Type in the numbers from a post's analytics and get its engagement rate in a second, with a rough benchmark, a breakdown of reactions, comments and reposts, and a tip for the next post. Add up to 10 posts to see which one worked best.

A post with 300 reactions sounds better than a post with 80. But if the first one was seen by 40,000 people and the second by 2,000, the second post did a far better job with the people who saw it. Engagement rate puts every post on the same scale, so you can compare them fairly.
On LinkedIn the usual formula is simple: add up the reactions, comments, reposts and clicks a post got, then divide by its impressions. LinkedIn uses this same idea for company page analytics, where engagement rate counts interactions such as clicks, reactions, comments and reposts against impressions.
This calculator does the maths for one post or for a batch. It also shows the rate by followers, which is useful when you are looking at someone else's post and cannot see its impressions.
On LinkedIn, open your post and click the impressions count or View analytics under it. You will see impressions, reactions, comments and reposts. Company page admins see clicks too.
Copy impressions, reactions, comments and reposts into the calculator. Clicks are optional. You can type 2,400 or 2.4k. The rate updates as you type.
Click Add another post and give each one a name. You get the rate for each post, the overall rate, and the best post highlighted.
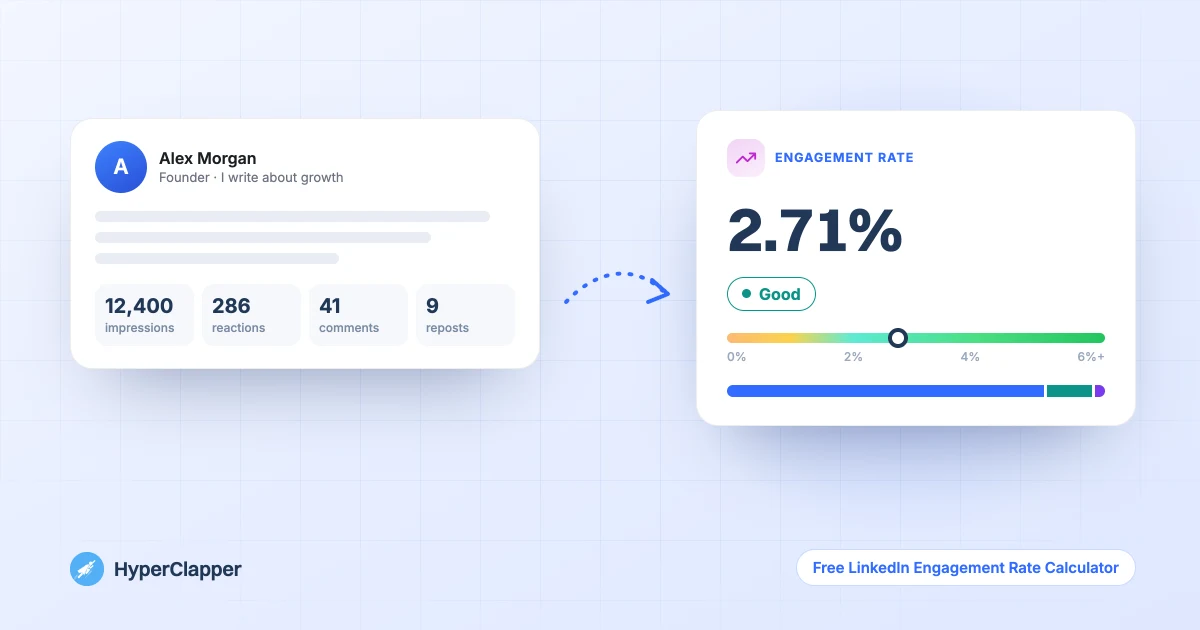
See where your rate sits on the scale, how your engagement splits between reactions, comments and reposts, and a tip for your next post. Copy the result to share it or keep it in a report.
Everything runs in your browser. There is nothing to install and no account to create.
The standard LinkedIn engagement rate: total engagements divided by impressions, shown to two decimal places.
Add your follower count to see average engagements per post as a share of your audience. Handy for comparing accounts when impressions are hidden.
A bar that shows how much of your engagement came from reactions, comments, reposts and clicks, so you can see what kind of response the post earned.
Name each post and see a table with impressions, engagements and rate for every one, with the best performer marked.
A simple scale from low to excellent so the number means something. It is a guide, not an official LinkedIn figure, and the right target depends on your audience.
Your numbers never leave your browser. No sign-up, no limit, nothing stored.
Two formulas are in common use. Which one you need depends on whether you can see the post's impressions.
This is the one to use for your own posts. It answers: of the people who saw this post, how many did something with it?
When you look at a competitor's or a creator's posts you cannot see their impressions, but you can see their follower count. Divide the average engagements per post by followers. The number is usually different from the impressions-based rate, so only compare it with other follower-based rates.
Reactions (like, celebrate, support, love, insightful, funny), comments and reposts are the visible ones. Clicks on the post, its link or your name count too when you can see them. LinkedIn's company page analytics also count new follows from a post. For personal posts, use what your analytics show and keep it consistent between posts.
There is no official LinkedIn benchmark for personal posts, and averages vary a lot by account size and industry. Use these ranges as a rough guide.
Many marketers treat around 2% as a solid rate for a LinkedIn post. The calculator uses these bands:
A post from an account with 800 followers is mostly seen by people who know the author, so a higher share of them engage. As an account grows, more impressions come from people further away, and the rate tends to drop even when the total engagement grows. Compare yourself with your own past posts first.
A post with many comments usually keeps spreading, because each comment shows the post to the commenter's network. If comments are under about 10% of your engagement, try ending posts with a real question and replying to every comment in the first hour.
Small changes to how a post starts, ends and is followed up usually matter more than how long it is.
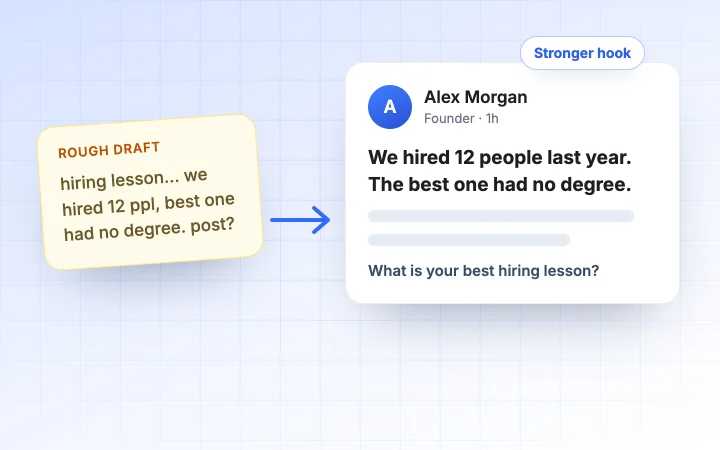
Most people decide whether to read on from the lines above "…more". Lead with a specific result, a surprising admission or a clear promise. Check where the cut falls with our free LinkedIn Post Preview tool.
Ask a question you actually want answered, about the reader's own experience. Questions with an easy, personal answer get more replies than broad opinion questions.
Look at when your best posts went out, and reply to comments during the first hour after posting. A post that gets conversation early tends to be shown to more people.
The first hour sets how far a post travels. HyperClapper gets real likes and comments from LinkedIn professionals on your post right after you publish, so it has the early response it needs to keep spreading.
A short walkthrough of how a good post plus a strong first hour helps you grow.
All free, all in your browser, no signup. See all free tools
Add up the reactions, comments, reposts and clicks a post received, divide by its impressions and multiply by 100. For example, 400 engagements on 12,400 impressions is a 3.23% engagement rate.
Open your post on LinkedIn and click the impressions count or View analytics under it. You will see impressions along with reactions, comments and reposts. Company page admins find post analytics in the page's Analytics section.
There is no official benchmark. As a rough guide, around 2% is solid, 1% to 2% is average for many accounts, and above 4% is excellent. Smaller accounts often see higher rates than large ones.
Use impressions for your own posts, because that measures how the people who saw the post reacted. Use followers when you cannot see impressions, for example when looking at someone else's posts, and only compare follower-based rates with each other.
Yes, when you can see them. LinkedIn's company page analytics include clicks in engagement. For personal posts, include clicks if your analytics show them and keep the same approach for every post you compare.
Yes. Click Add another post to compare up to 10 posts. You get each post's rate, the overall rate and the best post highlighted.
It is free with no sign-up and no limit. The numbers you type stay in your browser and are not sent or stored anywhere.
A falling rate often comes with a growing audience, because more impressions come from people who do not know you yet. Compare the total engagement too. If both are falling, look at your first two lines, how often you post and whether you reply to comments early.
HyperClapper gets real likes and comments from LinkedIn professionals on your post right after you publish, so it keeps reaching more people.
Grab 3 free boosts on your next LinkedIn post — real likes & comments from 5,000+ creators. No card, cancel anytime.
+5k