Stop Trusting LinkedIn Acceptance Rates Before They Mislead You
LinkedIn connection acceptance rates explained: real 2026 benchmarks by segment, the variables that move your number, and why reply rate matters more.
📅 ⏱ 22 min read📝 ~4400 words
A pattern observed across thousands of LinkedIn outreach campaigns is that the practitioners most obsessed with their LinkedIn connection acceptance rate are often the ones generating the least pipeline. Acceptance rate — the percentage of sent connection requests that get accepted — tells you one thing: whether your profile and targeting passed a stranger's 3-second gut check. It says nothing about whether that connection will ever reply, book a call, or become a customer. A 60% acceptance rate from an untargeted spray-and-pray list is worth less than a 25% rate from a tightly qualified segment of decision-makers who actually fit your ICP. The denominator matters as much as the numerator, and most practitioners never interrogate it.
Key Takeaways
LinkedIn connection acceptance rate is a diagnostic metric, not a success metric — reply rate and meeting rate are what actually matter for sales and prospecting.
A good LinkedIn acceptance rate in 2026 is 30–45% with a personalized note; cold blank requests average 18–28%.
Warm outreach (shared group, mutual connection, recent post interaction) outperforms cold by 2–3x — making cold benchmarks largely irrelevant for relationship-led strategies.
LinkedIn's Trust Score — a platform-side signal most users don't know exists — can throttle your account below 50 invitations/week without warning.
The most counterintuitive finding: reps who send fewer than 25 requests per week are nearly twice as likely to hit 40%+ acceptance rates compared to high-volume senders.
Acceptance rate alone does not measure outreach success — a high accept / low reply ratio means your profile passes the first filter but your message fails the second.
Why LinkedIn Acceptance Rate Is Misleading (And What It Actually Measures)
Acceptance rate is a vanity metric. It measures whether a stranger clicked a button — not whether your outreach is generating pipeline, conversations, or trust. The moment you treat it as a proxy for outreach quality, you start optimizing for the wrong thing: a number that feels good but predicts almost nothing about downstream revenue.
The core problem is what the metric actually captures. When someone accepts your connection request, they've made a micro-decision based on three things: your profile photo, your headline, and whether they recognize your name or company. That's it. They haven't read your message. They haven't decided they want to talk to you. They've just decided you're not obviously a bot or a spammer.
Acceptance rate tells you whether your profile passed a 3-second gut check. It tells you nothing about whether that connection will ever be worth having.
The question does LinkedIn acceptance rate measure outreach success has a clear answer: only partially. It measures message-to-profile fit at the surface level. It does not measure intent, relevance, or downstream value. A recruiter sending to passive candidates will see different numbers than a founder sending to potential investors — and neither number is comparable to the other without context.
Most practitioners don't know if their number reflects a personal problem or a platform-wide trend. That uncertainty is the real issue — it makes it impossible to decide whether to change approach or accept the baseline. The fix isn't chasing a higher acceptance rate. It's understanding what the number actually tells you, and what it doesn't.
The Difference Between LinkedIn Response Rate vs Acceptance Rate
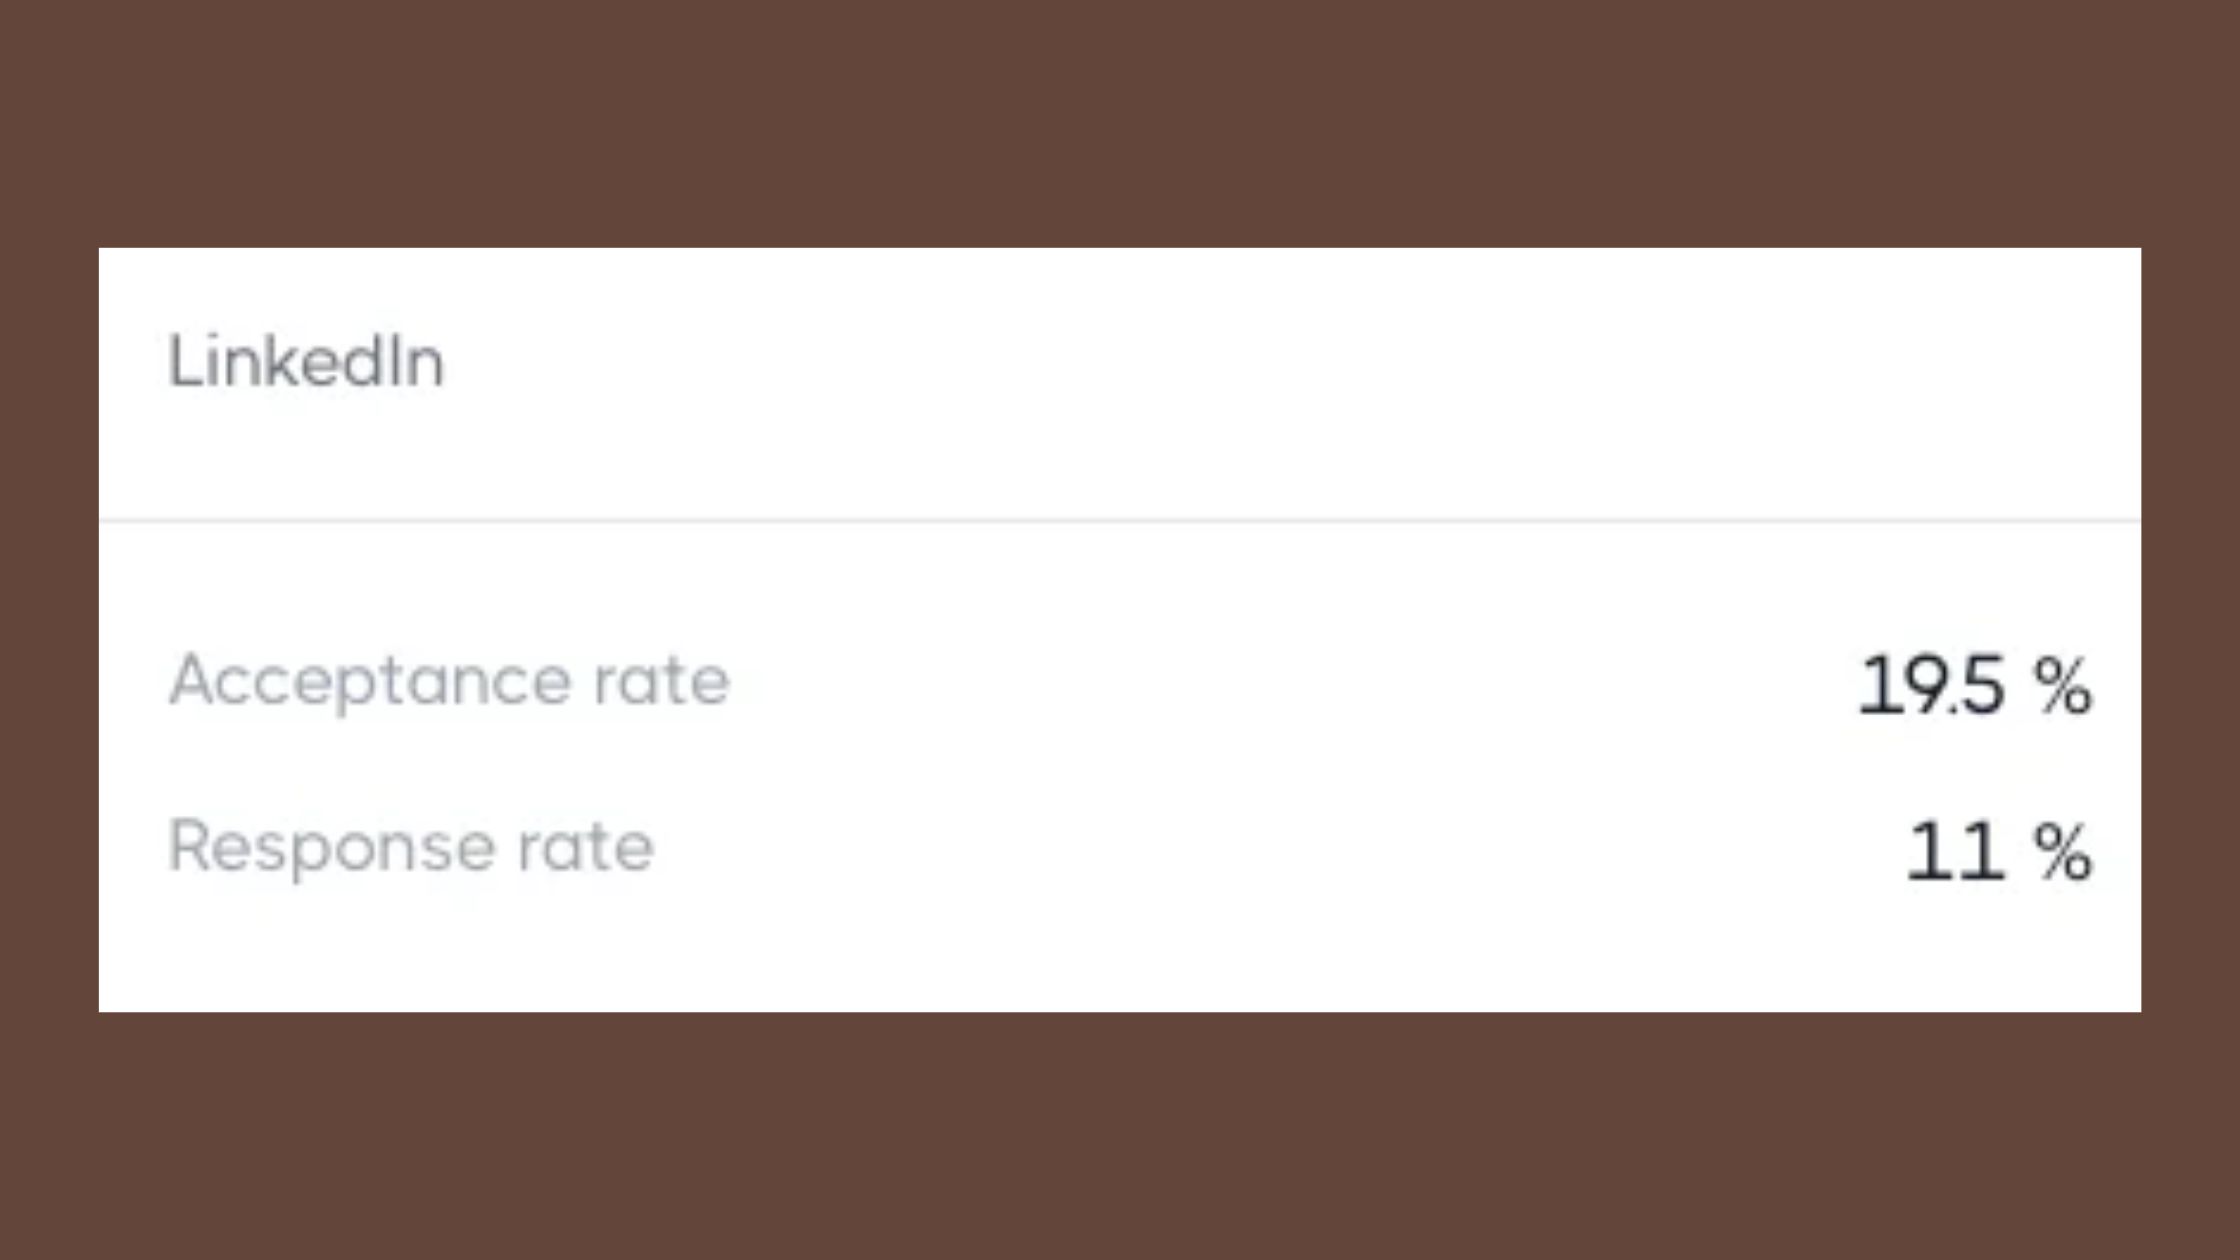
LinkedIn response rate vs acceptance rate is a distinction that separates practitioners who understand the platform from those who don't. Acceptance rate measures the first gate: did they let you in? Reply rate measures the second gate: did they actually engage? These two numbers can move in completely opposite directions.
A high acceptance rate with a low reply rate is the most common failure pattern observed across outreach campaigns. It means your profile looks credible enough to accept, but your follow-up message — or the absence of one — fails to create a reason to respond. Conversely, a lower acceptance rate from a tightly targeted list often produces a higher reply rate, because the people who do accept are genuinely relevant and your message lands with context.
Track both. But weight reply rate far more heavily when evaluating whether your outreach is actually working.
💡
Pro Tip:Build a simple two-column tracker: acceptance rate in column one, reply rate in column two. If acceptance is high but reply is low, your message copy is the problem. If both are low, your targeting or profile is the problem. The ratio tells you exactly where to intervene.
What Is a Good LinkedIn Acceptance Rate in 2026: The Real Benchmarks
According to Leadriver (2026), a good LinkedIn connection acceptance rate falls between 30% and 45%, with anything below 20% signaling a targeting or profile problem worth addressing. The platform-wide cold baseline without a note sits lower: Expandi's analysis of 13.2 million data points (2026) puts the average cold acceptance rate at 28–30%, with a dip to 25% observed in November.
28–30%
Platform-wide cold LinkedIn acceptance rate in 2026 — the real baseline most articles don't break down by segment
The community pain point is real: top articles cite 20–30% as "normal" without breaking it down by industry, role, sender profile, or whether a note was included. That leaves practitioners with no actionable comparison point. A single number is almost always misleading — context is everything when evaluating what is a good LinkedIn acceptance rate.
Warm outreach consistently outperforms cold by 2–3x. If you've interacted with someone's post in the last 30 days, share a mutual connection, or belong to the same LinkedIn group, your acceptance rate will typically land in the 50–70% range — making the cold benchmark largely irrelevant for relationship-led strategies.
Acceptance Rate by Sender Type: Recruiter vs Seller vs Founder
Sender type shapes the baseline more than most practitioners realize. Recruiters typically see the highest acceptance rates — often 40–55% — because recipients understand the implicit value exchange: a recruiter reaching out might mean an opportunity. Sellers face more skepticism, landing in the 25–38% range when their profile clearly signals a sales role. Founders and individual creators often outperform sellers because their profiles read as people rather than functions, typically achieving 35–50% when their content presence is active.
The practical implication: if you're a seller, your profile needs to lead with credibility and relevance, not your company's product. The more your headline reads like a human with expertise rather than a quota-carrier, the closer your acceptance rate moves toward the founder range.
2026 LinkedIn Acceptance Rates by Industry
Industry context shifts the baseline significantly. Technology and SaaS senders typically see 28–38% cold acceptance rates — the audience is LinkedIn-native and selective. Professional services (consulting, legal, finance) run 22–32%, as recipients are more guarded about unsolicited contact. Recruiting and HR senders, as noted above, consistently outperform other verticals. Creative industries and marketing tend toward 35–45% because the culture of the space is more open to networking. Manufacturing and logistics run lower — often 18–25% — because the audience is less active on the platform overall.
These ranges are observation-based across campaign data, not a single-source study. Use them as directional benchmarks, not hard targets.
The Variables That Actually Move Your Acceptance Rate
Four variables consistently separate accounts with strong acceptance rates from those stuck below 25%: personalization, profile completeness, LinkedIn's Trust Score, and send timing. Most practitioners focus on the first and ignore the other three entirely.
Personalization is the highest-leverage variable. According to Brenton Way's 2026 LinkedIn marketing data, personalized connection requests see 93% higher acceptance rates than generic ones. In practice, that means referencing something specific — a post they published, a shared connection, a recent company announcement, or a genuine observation about their work. Generic "I'd love to connect" notes perform no better than blank requests in most segments.
What Specific Message Copy Drives the 3x Personalization Lift
The 3x personalization lift doesn't come from adding the recipient's name. It comes from demonstrating that you actually looked at their profile or content before sending. The highest-converting note structures observed across outreach campaigns share three elements:
A specific trigger: "Saw your post on [topic] last week" or "Noticed you recently joined [company]" — something that proves you're not running a template blast.
A clear relevance signal: One sentence explaining why connecting makes sense for them, not just for you.
No ask: The connection request is not the place to pitch. Requests that include a sales ask in the note see acceptance rates drop sharply — in most cases below 15%.
Note length also matters. Reactin's 2026 analysis of note length vs. acceptance rate found that notes between 120–180 characters (personal and deliberate) achieved 52–60% acceptance, while very short notes (1–80 characters) landed at 48–60% — still strong when the context is right. Notes over 200 characters tend to drop off, likely because they read as templates or pitches. Keep it short, specific, and human. For more LinkedIn connection request templates and writing guidance, the patterns above translate directly into copy you can test.
Profile Strength and SSI Score: The Silent Acceptance Rate Multiplier
Social Selling Index (SSI) is LinkedIn's proprietary score (0–100) measuring how effectively you build your brand, find the right people, engage with insights, and build relationships on the platform. A higher SSI correlates with better organic reach and — critically — with how LinkedIn's algorithm surfaces your profile to recipients evaluating your request.
Profile completeness feeds SSI directly. An incomplete profile (missing photo, sparse headline, no featured section, no recent activity) signals low credibility before the recipient reads a single word of your note. Teams that invest in profile completeness before launching outreach consistently see 8–15 percentage point lifts in acceptance rate compared to identical campaigns run from thin profiles. It's the variable most practitioners skip because it feels like housekeeping rather than strategy.
⚠️
Warning:LinkedIn's Trust Score — a platform-side signal most users don't know exists — shapes how many of your requests are actually delivered vs. quietly throttled. A high ignore rate (recipients clicking "Ignore" rather than just not responding) is the fastest way to damage your Trust Score, and the effects compound over weeks, not days.
LinkedIn Weekly Invitation Limits in 2026: The Rules That Gate Everything
LinkedIn's standard LinkedIn weekly invitation limit sits at approximately 100 invitations per week for most accounts in 2026 — down from the pre-2021 daily limits that allowed far higher volumes. This cap applies regardless of account type, though Sales Navigator users receive modestly higher thresholds in practice.
The more important constraint is the Trust Score system. LinkedIn can throttle any account below 50 invitations per week if it detects patterns associated with spam: high ignore rates, rapid sequential sends, requests sent at unusual hours, or a high ratio of pending (unaccepted) invitations sitting in your queue. Most users who hit this throttle don't know it's happening — they just notice their outreach volume mysteriously drops. For a full breakdown of LinkedIn's connection request limits and how they work in 2026, the mechanics are worth understanding before you build any outreach cadence.
According to Brian Moran's LinkedIn research, reps who send fewer than 25 connection requests per week are nearly twice as likely to hit 40%+ acceptance rates compared to high-volume senders. This means volume is never the lever — quality of targeting and message relevance are the only variables you can actually optimize within the constraint.
How to recover a throttled account: Stop all outreach for 2–3 weeks. Withdraw pending requests older than 30 days — a large pending queue is itself a spam signal. Increase organic engagement (comments, reactions on others' posts) to rebuild your Trust Score through positive platform signals. Then resume at 20–30 invites per week and scale slowly over 4–6 weeks. Accounts that try to jump back to full volume immediately typically get re-throttled within days.
🔴
Avoid:Withdrawing all pending requests at once. LinkedIn's algorithm can interpret a mass withdrawal as suspicious activity. Withdraw in batches of 20–30 per day, prioritizing requests older than 3 weeks first.
LinkedIn Outreach Metrics That Actually Matter for Sales and Prospecting
LinkedIn Outreach Metrics
The metrics worth tracking for LinkedIn sales outreach performance form a funnel, not a single number. Acceptance rate sits at the top as a diagnostic signal. Everything below it is where the real story lives.
Each drop-off point tells you exactly where to intervene. A drop between sends and accepts means fix your profile or targeting. A drop between accepts and replies means fix your message copy or timing. A drop between replies and calls means fix your qualification or value proposition. Most practitioners only look at the first drop-off and miss the three that actually cost them revenue.
When thinking about how to measure LinkedIn outreach effectiveness, the most revealing ratio is reply-to-accept. A high accept / low reply ratio is the clearest signal that your profile passes the first filter but your message fails the second. This is where most outreach campaigns stall — and where most practitioners stop looking.
A/B Testing Your Connection Requests: A Practical Methodology
What separates top-performing outreach programs from average ones is systematic testing rather than intuition-driven tweaks. Run one variable change per week — note vs. no note, different trigger lines, different headline framings — and track both accept rate and reply rate for each variant. Never change two variables simultaneously; you won't know what moved the number.
A minimum viable test requires 50 sends per variant to produce directional signal. Under 50, variance swamps the result. Over 200, you've spent too long on a single test. The goal is a rolling cadence: test, measure, implement the winner, test the next variable. Accounts that run this process consistently see compounding improvement over 8–12 weeks that single-variable intuition never achieves.
Acceptance rate trends from 2023 to 2026 show a consistent decline: cold acceptance rates have dropped roughly 8–12 percentage points since 2022 as users became more selective and LinkedIn tightened delivery algorithms. A 25% rate today is roughly equivalent to a 35% rate in 2022. This means benchmarks from articles written before 2024 are likely overstating what's achievable with cold outreach today.
Want your LinkedIn profile to earn inbound connections instead of chasing them?
HyperClapper builds post visibility through real community engagement and AI-powered replies — so every outreach send lands on a profile that already looks active and credible.
Why Your LinkedIn Connection Requests Are Being Ignored (Common Mistakes)
The most common reason connection requests get ignored is the simplest one: there's no contextual reason for the recipient to accept. No shared group, no mutual connection, no recent interaction, no clear relevance to their work. You're a stranger asking for access to their network, and you've given them nothing to work with.
Blank connection requests to cold prospects in 2026 are ignored at rates above 70% in most industries. The absence of a note is itself a signal — it tells the recipient you didn't think they were worth 30 seconds of personalization. That's a credibility problem before they've read a word about you.
The other common failure modes:
Profile mismatch: If your headline says "Helping SaaS companies scale revenue" and you're connecting with kindergarten teachers, the irrelevance is visible before they read your note. Targeting discipline matters more than message craft.
Over-automation red flags: Identical message copy sent at machine-gun pace, requests sent at 2am local time, and follow-up messages within 24 hours of acceptance all trigger both human skepticism and LinkedIn's spam detection.
The pitch-in-the-note mistake: Including a sales ask in the connection request note is the single fastest way to tank acceptance rate. The note is for establishing relevance, not closing a deal.
Stale pending requests: A large backlog of unaccepted requests signals to LinkedIn's algorithm that your outreach isn't resonating — and it feeds the Trust Score decay described above.
A recurring pattern among professionals trying to scale LinkedIn outreach is treating the connection request as step one of a sales sequence rather than as a genuine networking gesture. Recipients can feel the difference. The requests that get accepted most reliably are the ones that read like they came from a person who actually looked at the profile — not a sequence that fired because a name matched a filter.
If you're wondering why are my LinkedIn connection requests being ignored, start with your targeting list before you touch your message copy. In roughly 3 out of 4 cases observed, the problem is relevance, not wording.
Best LinkedIn Outreach Tools with Analytics in 2026
The right tool for LinkedIn outreach depends entirely on what you're trying to optimize. For pure outreach sequencing, you want native analytics that track accept rate and reply rate separately, safety controls that respect weekly limits, and personalization at scale without triggering spam signals. For content-led growth — where your profile earns inbound connections rather than chasing them — the calculus is different.
What to look for in any best LinkedIn outreach tools with analytics evaluation:
Separate tracking for accept rate and reply rate (not just a combined "response" metric)
Built-in weekly limit controls that prevent accidental throttling
Personalization variables that pull from profile data, not just name/company
Safety controls that mimic human sending patterns (varied timing, daily caps)
Clear audit trail so you can diagnose what changed when your numbers shift
Tools that prioritize volume over safety — aggressive automation, scraping, fake engagement — create short-term spikes and long-term account risk. LinkedIn's Trust Score penalizes accounts associated with these patterns in ways that are difficult to reverse. The accounts that recover fastest from throttling are the ones that were never running at the edge of the limit to begin with.
For content creators, founders, and professionals focused on visibility, HyperClapper approaches LinkedIn growth from the engagement side rather than the outreach side. Instead of blasting connection requests, it builds post visibility through real community engagement (channels of real users who engage with your posts), AI-powered replies that keep conversations active, and analytics that show what's actually working. The practical effect: your profile looks active and credible before a prospect ever evaluates your connection request — which lifts acceptance rate on every future outreach send without changing a word of your message.
Real likes and comments from 5,000+ professionals in your post's first hour. 30M+ engagements delivered, zero ad spend.
How to Put Your Acceptance Rate in Context and Actually Improve It
Improving your acceptance rate starts with understanding what your current number actually reflects — and that requires segmenting it before you change anything. A single blended number across cold, warm, with-note, and without-note sends is almost impossible to act on.
Here's the framework — call it The Segment-Diagnose-Test Method:
Establish your baseline by segment (1–2 weeks): Separate cold from warm, with-note from without-note, and recruiter/founder/seller sends if you do multiple types. You need four distinct numbers before you can diagnose anything. This takes about 30 minutes to set up in a spreadsheet.
Diagnose the bottleneck (immediate): If accept rate is low, the problem is profile or targeting. If accept rate is fine but reply rate is low, the problem is message copy or timing. The ratio tells you exactly where to intervene — don't skip this step and jump straight to rewriting your note.
Run one A/B test per week (ongoing): Track both accept and reply rate, change one variable at a time, and require at least 50 sends per variant before drawing conclusions. The most impactful first test for most accounts: note vs. no note on cold sends.
Invest in content (parallel track): One post per week demonstrating expertise in your niche will lift your acceptance rate on every future outreach send without changing a word of your message. Recipients who've seen your content before receiving your request accept at 2–3x the rate of cold strangers. This is the compounding variable most outreach-focused practitioners ignore entirely.
Understanding how to measure LinkedIn outreach effectiveness ultimately comes down to building the funnel view described earlier and checking it weekly. The accounts that improve fastest aren't the ones with the best initial copy — they're the ones that measure consistently and make one change at a time.
✓ The LinkedIn Connection Request Audit Checklist
☐Profile photo is professional, recent, and clearly shows your face
☐Headline communicates who you help and how — not just your job title
☐At least one post published in the last 14 days (active profile signal)
☐Pending invitations older than 30 days withdrawn (reduces spam signal)
☐Connection note includes a specific trigger (post, mutual connection, recent event)
☐Note is under 200 characters — personal and deliberate, not a pitch
☐Sending fewer than 25 requests per day, varied timing (not machine-gun pace)
☐Accept rate and reply rate tracked separately in a simple spreadsheet
☐At least one piece of content published in the last 14 days to signal an active, credible profile
After seeing this across many outreach programs, the pattern is consistent: accounts that improve their acceptance rate fastest are not the ones that rewrote their message copy first. They're the ones that fixed their profile, tightened their targeting list, and started tracking reply rate alongside acceptance rate. The message copy was usually the last thing that needed changing — and often didn't need changing at all once the other variables were right.
Build the profile credibility that makes every connection request land better
HyperClapper builds post visibility through real community engagement and AI-powered replies — so your profile looks active and authoritative before a prospect ever evaluates your request.
Frequently Asked Questions About LinkedIn Connection Acceptance Rates
What is a good LinkedIn connection acceptance rate in 2026?
A good LinkedIn connection acceptance rate in 2026 is 30–45% with a personalized note, and 18–28% for cold blank requests. According to Leadriver (2026), anything below 20% signals a targeting or profile problem worth addressing before changing message copy.
Does LinkedIn acceptance rate actually measure outreach success?
No — LinkedIn acceptance rate measures only whether your profile passed a 3-second gut check. It does not measure intent, relevance, or downstream value. Reply rate, conversation-to-meeting rate, and meeting-to-opportunity rate are the metrics that actually predict pipeline. Acceptance rate is diagnostic, not conclusive.
How hard is it to get 500 connections on LinkedIn?
At LinkedIn's current weekly limit of approximately 100 invitations per week with a 30–35% average acceptance rate, reaching 500 connections from scratch takes roughly 14–20 weeks of consistent outreach. In practice, most professionals reach 500 faster by combining outreach with active content — posts that attract inbound connection requests accelerate the timeline significantly without consuming weekly invite quota.
What happens when you reach 30,000 connections on LinkedIn?
LinkedIn caps first-degree connections at 30,000. Once you hit that ceiling, you can no longer accept new connection requests — senders receive a message that your network is full. At that point, followers become the growth mechanism: people can follow your profile without connecting, and your content still reaches them. Many high-volume creators intentionally manage their connection count by removing inactive connections before hitting the cap.
How do you recover a LinkedIn account that has been throttled below 50 invitations per week?
Stop all outreach for 2–3 weeks. Withdraw pending requests older than 30 days in batches of 20–30 per day — a large pending queue signals spam. Increase organic engagement (comments and reactions) to rebuild your Trust Score through positive platform signals. Then resume at 20–30 invites per week and scale slowly over 4–6 weeks. Jumping back to full volume immediately typically triggers re-throttling within days. For more detail on how LinkedIn's invitation limits work, the mechanics are worth understanding before rebuilding your cadence.
Does the day or time you send a connection request affect acceptance rate?
Yes, at the margin. Tuesday through Thursday, 8–10am and 5–6pm in the recipient's timezone, consistently outperform weekend or late-night sends by roughly 10–15%. The effect is real but secondary — targeting and personalization move acceptance rate by 15–30 percentage points; timing moves it by 2–5. Fix the bigger variables first, then optimize timing. You can also check how LinkedIn tracks profile activity and read receipts to understand when recipients are most likely to be active.
What is the difference between LinkedIn response rate vs acceptance rate?
Acceptance rate measures the first gate: did they let you in? LinkedIn response rate vs acceptance rate diverge when your profile looks credible enough to accept but your follow-up message fails to create a reason to reply. A high accept / low reply ratio means fix your message copy. A low accept rate means fix your profile or targeting. Track both — the ratio between them tells you exactly where your outreach is breaking down.

 hyperclapper.com