A pattern observed across thousands of X/Twitter accounts is that the creators obsessing over posting frequency are usually the ones with the flattest engagement curves. Engagement rate on Twitter — total interactions divided by impressions — is almost never a volume problem. It's a signal quality problem. The accounts that consistently outperform their follower count share three traits: they write for response, they engage before they post, and they understand exactly which actions the algorithm rewards. This guide gives you the diagnostic framework and the tactics to fix your rate without adding a single extra tweet to your schedule.
- Engagement rate = total interactions ÷ impressions — the impressions formula is more accurate than the follower formula on X/Twitter in 2026
- A "good" rate depends entirely on your follower tier — 0.6% at 500K followers is healthy; 0.6% at 500 followers signals a problem
- The X algorithm in 2026 weights reply depth and quote tweet conversations far more than passive likes
- Your first 30–90 minutes after posting is the only window that meaningfully affects algorithmic reach — not total post volume
- The highest-leverage free tactic most people skip: replying to larger accounts in your niche within 30 minutes of their posts
- Low engagement at under 1K followers is almost always a distribution problem, not a content quality problem
- What Is Twitter Engagement Rate (And What Actually Counts)?
- What Is a Good Engagement Rate on Twitter — By Follower Tier and Niche
- How the Twitter Algorithm Decides What to Show in 2026
- Proven Tactics to Increase Twitter Engagement Rate Without Posting More
- Why Is My Twitter Engagement So Low — A Diagnostic Framework
- Frequently Asked Questions About Twitter Engagement Rate
What Is Twitter Engagement Rate (And What Actually Counts)?
Engagement rate in Twitter is a metric that measures what percentage of people who saw your tweet actually interacted with it. It tells you not just how many people you reached, but how many of those people cared enough to respond. On X (formerly Twitter), the impressions-based formula is more accurate than the follower-based one — because algorithmic reach means your tweets regularly land in front of people who don't follow you at all.
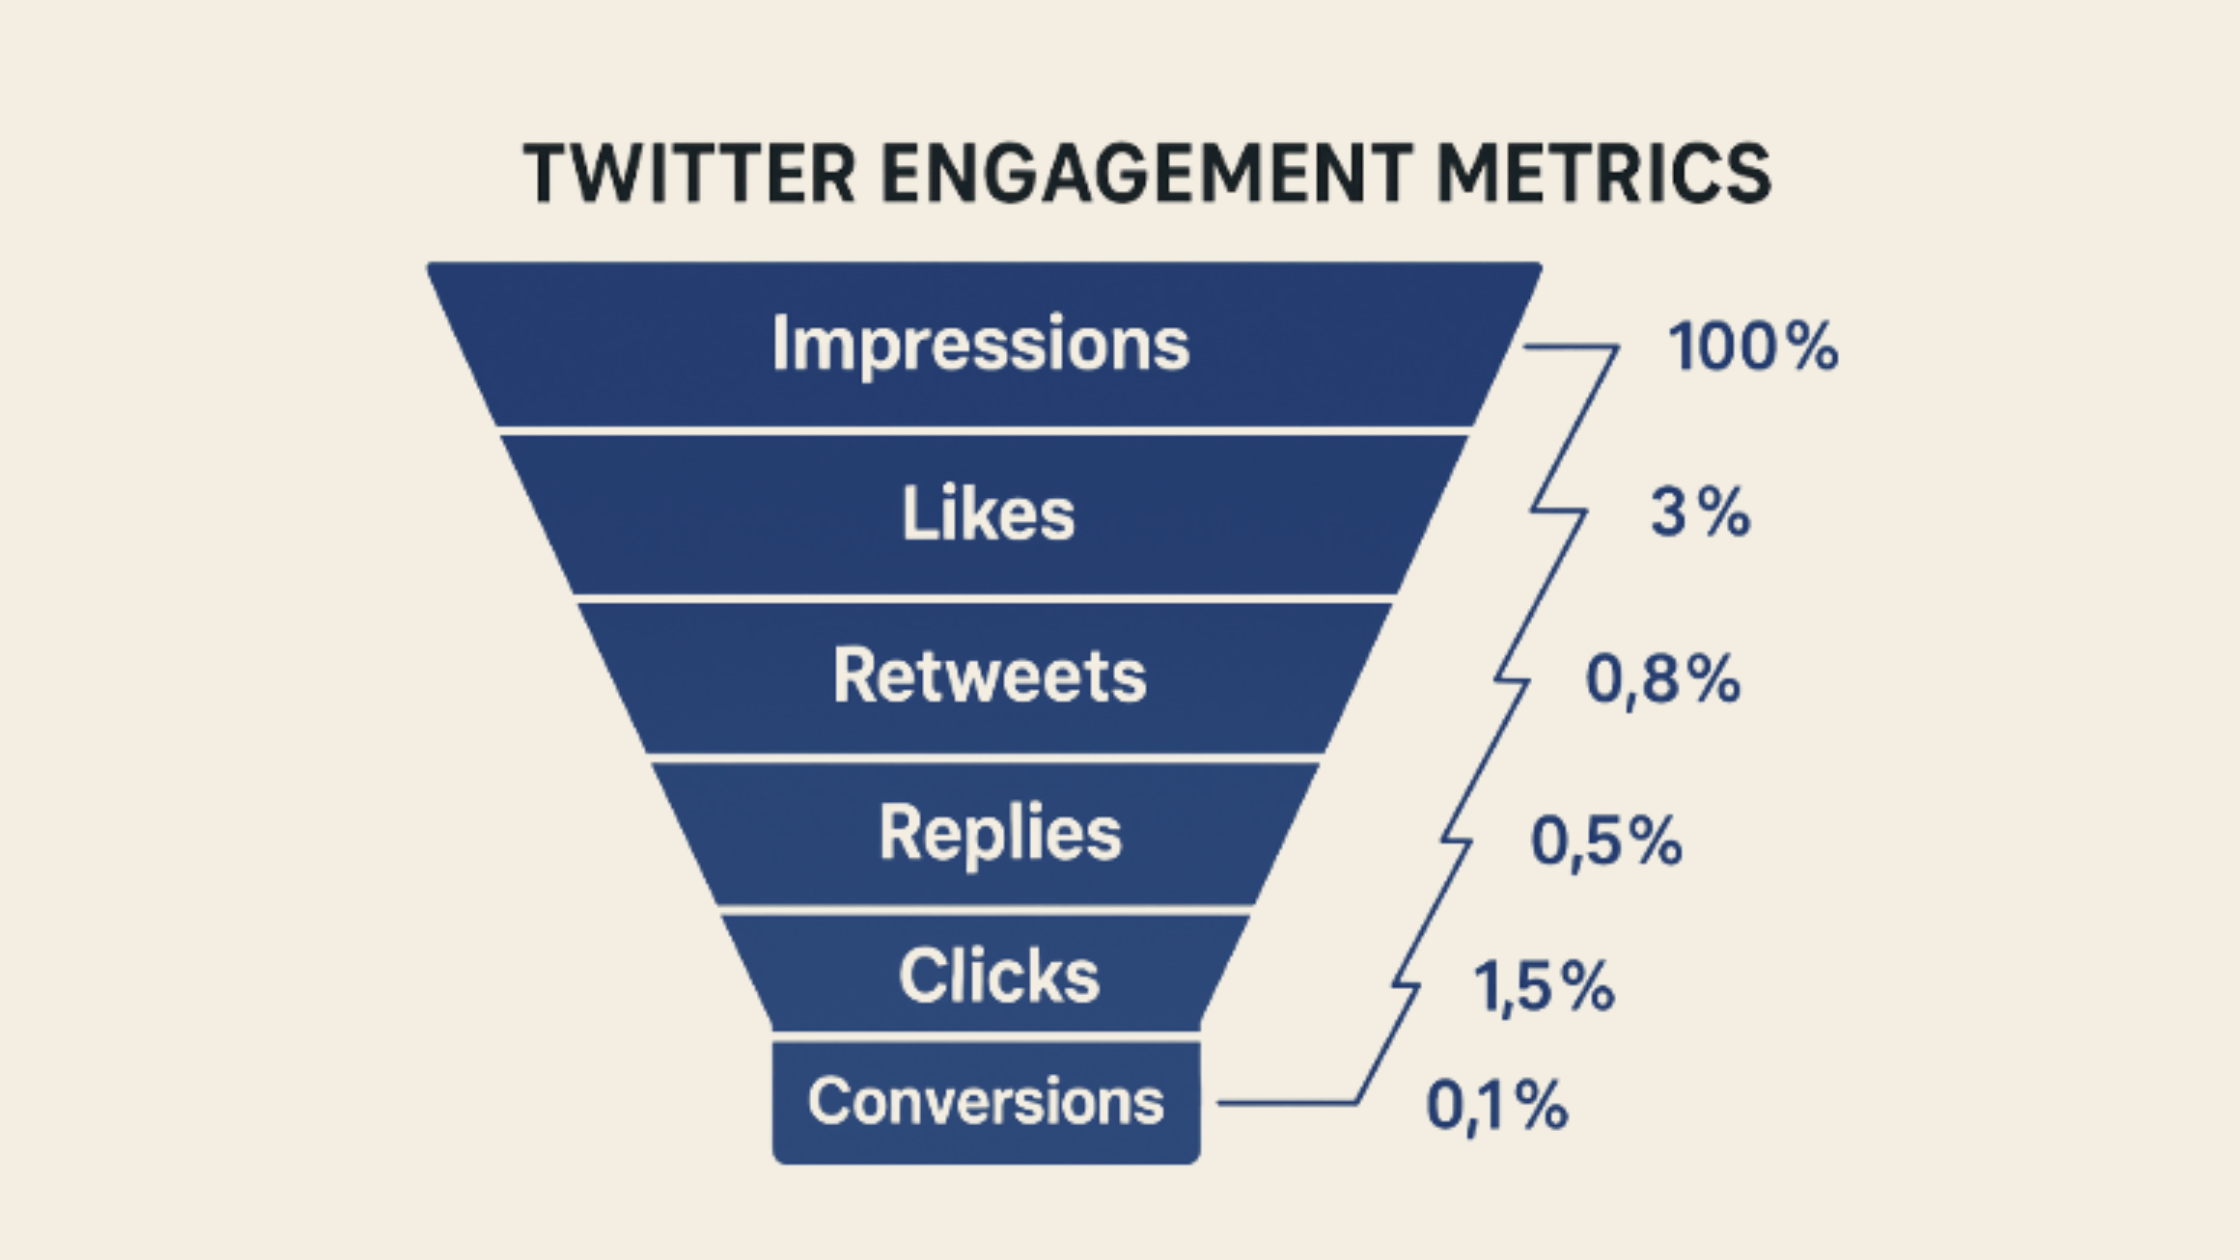
Every one of the following actions counts as an engagement in the Twitter analytics dashboard:
- Likes — the most common, and the least algorithmically valuable
- Retweets and quote tweets — quote tweets carry more weight because they generate a new conversation thread
- Replies — the highest-signal engagement; reply depth is what the algorithm uses to decide whether to extend a post's reach
- Link clicks — tracked but not always surfaced prominently in native analytics
- Profile clicks — indicate intent to learn more about you; useful for diagnosing audience-content alignment
- Media views — counted separately from impressions; a video view does not automatically equal an engagement
The critical distinction is tweet impressions vs engagement: impressions measure how many times a tweet appeared on a screen; engagements measure how many times someone acted on it. Conflating the two is the most common reason creators misread their performance — high impressions with low engagements means distribution is working but the content isn't prompting response.
How to Calculate Your Engagement Rate on Twitter
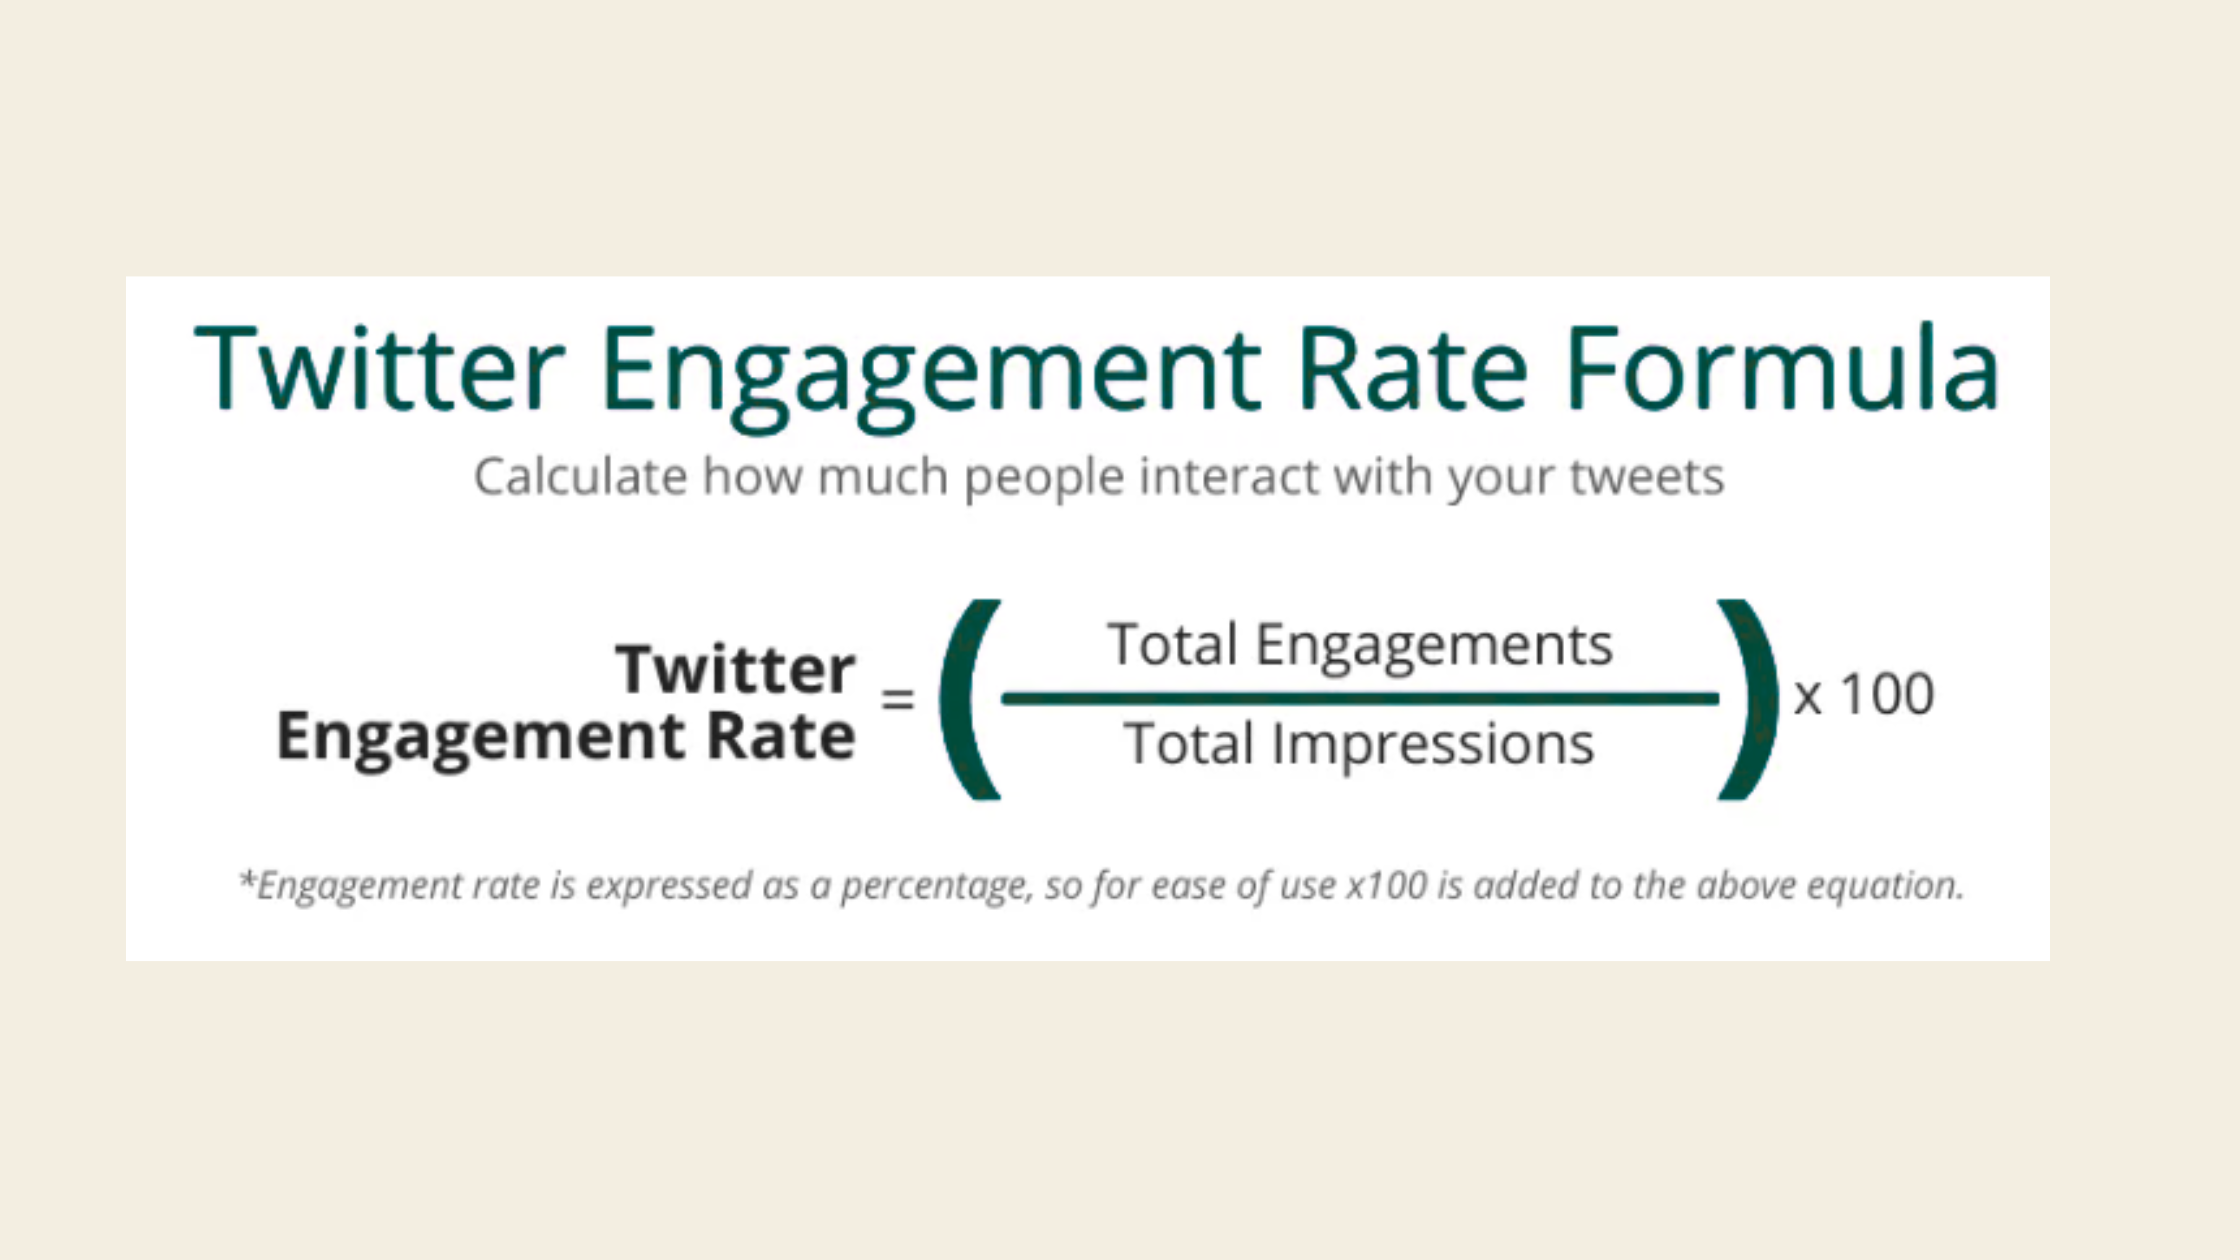
The Twitter engagement rate formula using impressions (recommended):
Engagement Rate = (Total Engagements ÷ Total Impressions) × 100
Example: a tweet with 388 total engagements and 10,000 impressions = 3.88%. If your tweet had 488 engagements on 10,000 impressions, that's 4.88% — worth double-checking the arithmetic before drawing conclusions. To how to find engagement rate on twitter natively, open X Analytics (analytics.twitter.com), click any tweet, and you'll see impressions and total engagements side by side. Divide and multiply by 100.
What Is a Good Engagement Rate on Twitter — By Follower Tier and Niche
The flat industry average you see repeated across the web — "0.5% to 1.5% is good" — is genuinely misleading without follower context. According to Phlanx's 2026 influencer engagement data, accounts with 1K–5K followers average 5.60%, while accounts with over 1 million followers average just 1.97%. A rate that looks "low" at 500K followers would be a disaster signal at 5K followers. These are the tier-specific Twitter engagement rate benchmark ranges to use for self-diagnosis:
- Under 1,000 followers: 3–6% healthy; below 1.5% warrants a content audit
- 1,000–10,000 followers: 1–3% is solid; this is where most active creators sit
- 10,000–100,000 followers: 0.5–1.5% is expected; above 2% is strong
- 100,000+ followers: 0.3–0.8% is normal; consistent 1%+ signals genuinely strong content
According to SociaVault's 2026 benchmark report, the median engagement rate on Twitter/X is 1.11% — down 9% year-on-year — making it the lowest of any major platform. This means that what is a good engagement rate on Twitter in 2026 is a lower bar than it was two years ago, but also that the gap between average and top performers has widened. In practice, a rate above 2% at any follower tier puts you in the top quartile.
Niche matters as much as follower count. Creator, entertainment, sports, and crypto accounts consistently outperform B2B and news accounts — emotionally charged niches generate reply chains naturally. According to Hootsuite's 2026 industry benchmark data, the average X engagement rate in education is 1.7%, suggesting that informational niches can outperform the median when content genuinely teaches something.
Is a 20% Engagement Rate Good — or Too Good to Be Real?
A 20% engagement rate is almost always a signal of something unusual: a very small and highly engaged audience (under 200 followers), a single viral moment skewing the average, or inflated metrics from engagement pods or bot activity. What is a good engagement rate for twitter at scale sits well below 20% — so if your average across 30+ tweets is 20%, audit your audience quality first before celebrating. Genuine 20% rates at 500+ followers are extremely rare and typically tied to niche expert accounts with a cult-like following.
How the Twitter Algorithm Decides What to Show in 2026
The Twitter algorithm 2024 engagement priorities that many guides still cite have evolved. In 2026, X's ranking model prioritises reply depth and quote tweet conversations over passive likes. This means a tweet with 5 replies that spark a 20-reply thread outperforms a tweet with 200 likes and zero replies — the former extends the engagement window, the latter closes it quickly. Teams that build content designed to generate replies consistently see longer algorithmic distribution windows than teams optimising for likes alone.
Post reach organic decay — the speed at which a tweet loses algorithmic momentum after posting — is the mechanism most creators misunderstand. Tweets lose reach velocity within 30–90 minutes of posting. The algorithm uses that first-hour engagement signal to decide whether to push the content into the For You feeds of non-followers. This is why the first hour matters far more than how often you post — and why most efforts to improve Twitter engagement without posting more should start here.
How does the Twitter algorithm decide what to show beyond that first window? Thread reply chains and long-form content extend reach by creating new engagement events. Each new reply to a thread is treated as fresh engagement on the original post. This is the mechanism behind why threads consistently outperform single-tweet posts at comparable follower counts.
Best Time to Post on Twitter for Engagement
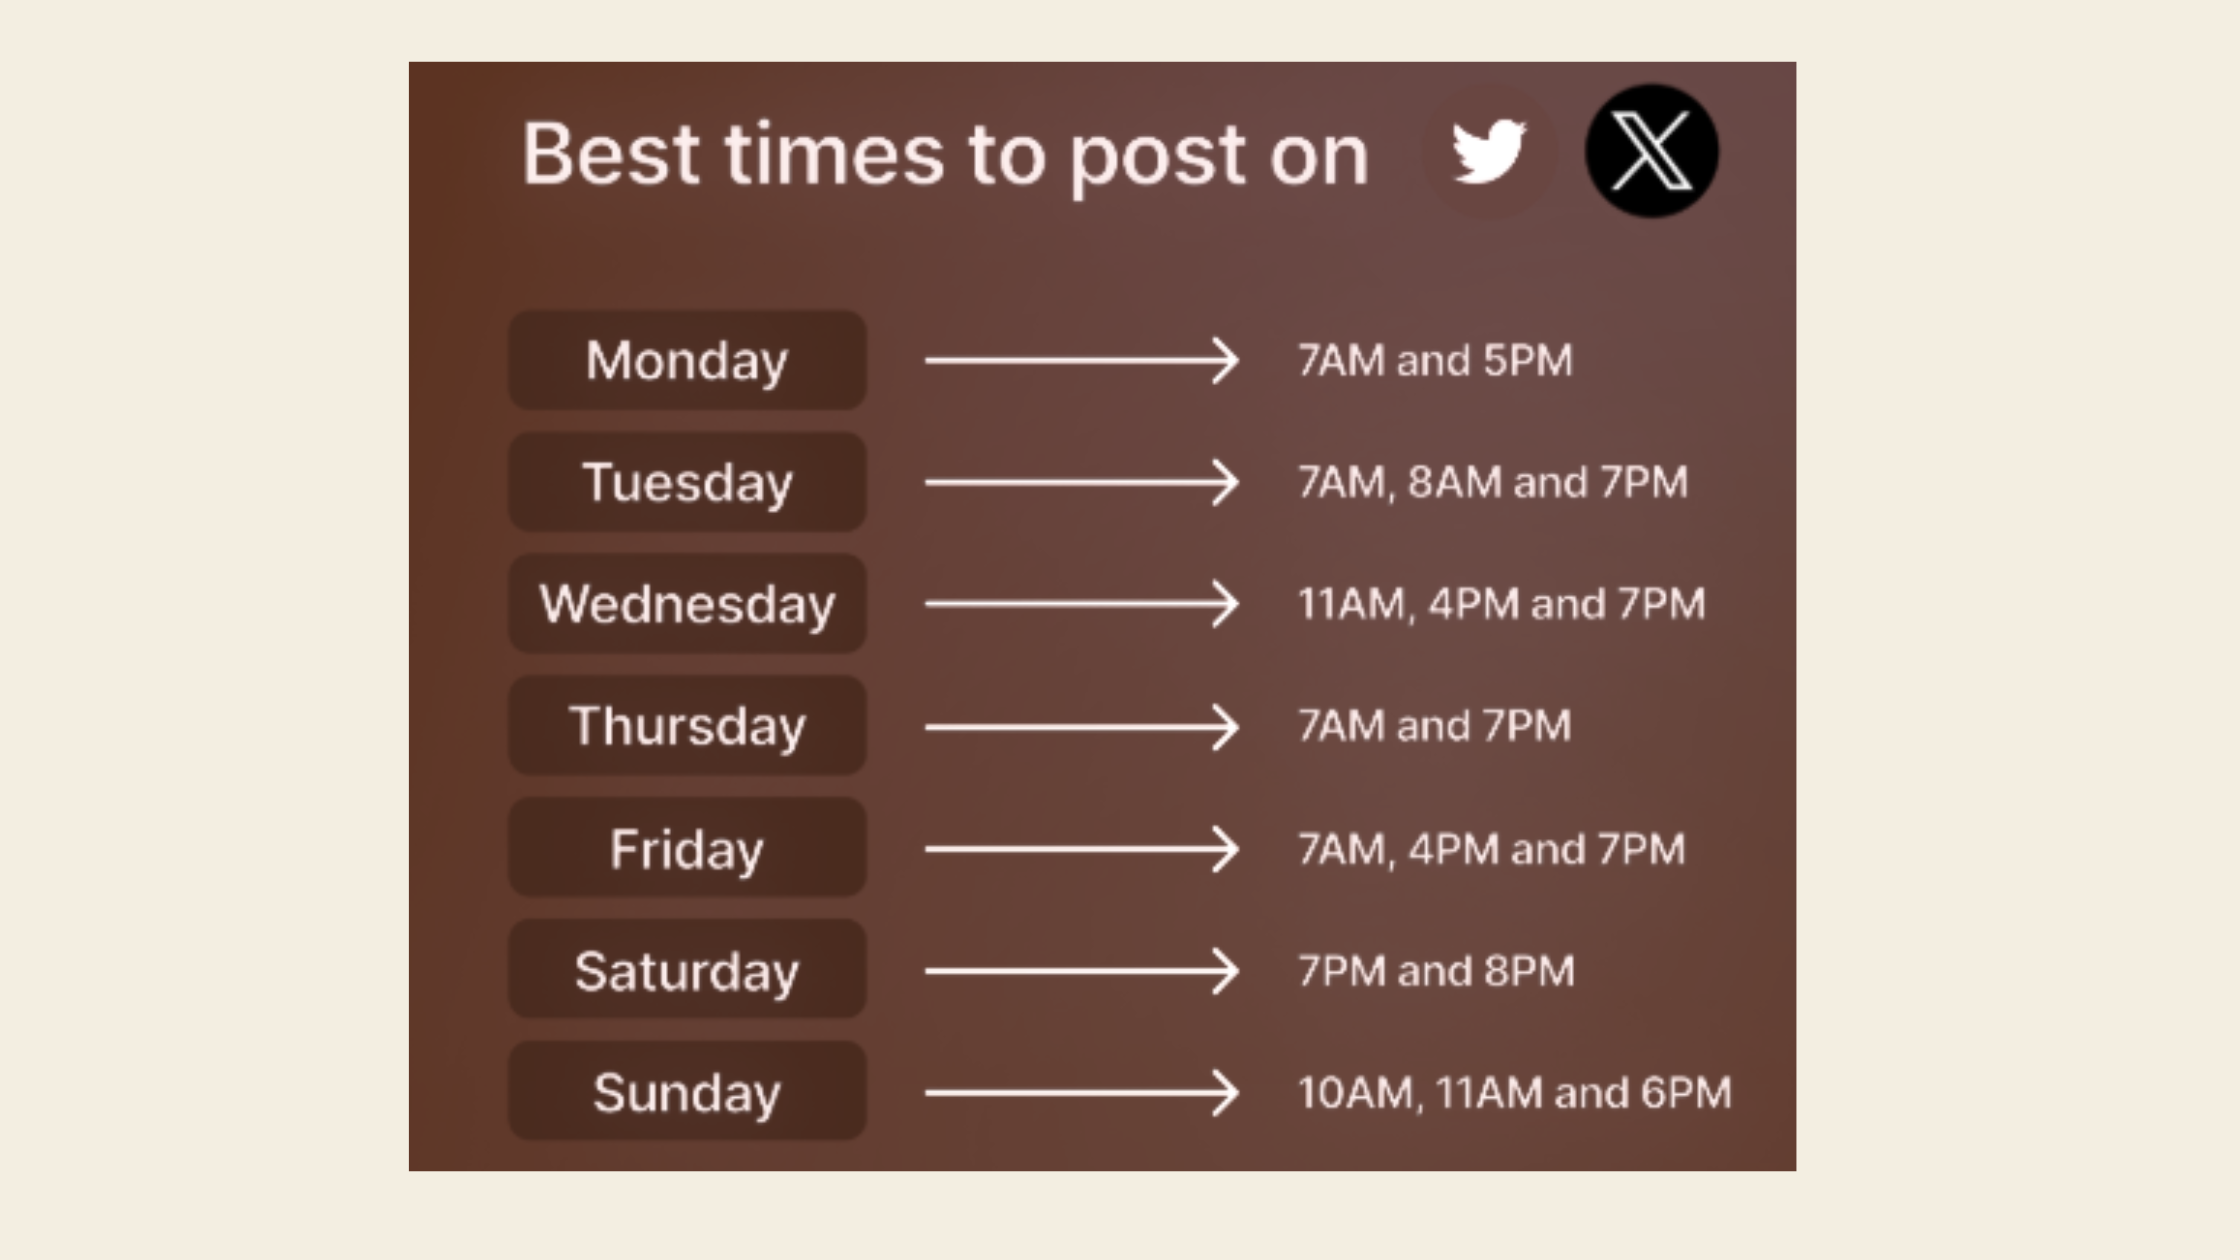
The best time to post on Twitter for engagement depends on your specific audience's timezone and behaviour, but a consistent pattern across general accounts shows peaks between 8–10am and 6–9pm in your audience's primary timezone. What matters more than the exact hour is posting when you can be present for the first 30–60 minutes — because responding to early replies is the single biggest lever for extending that first-hour algorithmic window. A tweet posted at the "optimal" time where you're unavailable to respond will underperform a tweet posted at a slightly off-peak time where you're actively engaging.
Proven Tactics to Increase Twitter Engagement Rate Without Posting More
The most direct way to increase Twitter engagement rate without increasing post frequency is to extract more response from what you already publish. Most accounts are leaving engagement on the table in three specific places: the hook, the call to action, and the reply strategy.
How to write better Twitter captions — the mechanics that consistently work:
- Lead with tension or a counterintuitive claim in the first line — it's the only text the algorithm previews before the "show more" cut
- Keep the first line standalone and complete; if someone only reads that one line, they should still feel something
- End with a specific, easy-to-answer question — "Agree?" generates replies; "What do you think about all of this in general?" does not
- Use specific numbers over vague claims — "3 replies in the first 10 minutes" outperforms "some early replies"
The Twitter reply strategy to boost engagement that most people skip: reply to accounts with 5–20x your follower count within 30 minutes of their posts. A thoughtful, specific reply that adds value gets seen by their entire engaged audience. This is the highest-leverage free tactic for growing both reach and follower-to-engagement ratio — and it costs zero additional tweets.
To get more retweets and replies, three specific tactics work consistently:
- Quote tweet your own older high-performing post with a new take or updated angle — it refreshes the content and creates a new engagement event (30 seconds to set up)
- Thread a follow-up to a well-performing tweet — "update on this" threads regularly outperform the original because followers are already primed (2 minutes to write)
- Ask for the retweet explicitly when the content is genuinely useful — "RT if this helped" still works, though it reads better as "share this if you know someone who needs it"
The accounts growing fastest on X are not the ones posting most — they are the ones making every post feel like the start of a conversation, not a broadcast.
Common Mistakes That Kill Your Twitter Engagement Rate
The most common failure mode is writing tweets as statements rather than prompts. A tweet that tells the reader something and ends there invites a like at best. A tweet that tells the reader something and then asks a specific question invites a reply — and replies are what extend algorithmic reach. The fix is one sentence at the end of every tweet: a direct, low-friction question that takes three seconds to answer.
Does posting frequency affect Twitter engagement? Yes — but not in the direction most people assume. Accounts that post more than 5–6 times per day on X consistently see per-tweet engagement rates drop, because each new post competes with the previous one for the algorithm's attention. More posts don't compound reach — they fragment it. Consistent quality at 1–3 posts per day outperforms high-volume low-quality posting in almost every case observed.
Best Twitter Analytics Tools for Engagement Tracking
The best Twitter analytics tools for engagement tracking beyond native X Analytics include:
- Sprout Social — deep audience interaction metrics and competitor benchmarking; best for teams
- RivalIQ — industry-specific engagement benchmarks; useful for comparing your rate against sector averages
- Hootsuite Analytics — cross-platform view; useful if you're managing Twitter/X alongside other channels
- Metricool — solid free tier with engagement breakdown by content type; good for solo creators
For Twitter scheduling tools comparison, the key differentiator is whether the tool lets you engage from within the platform after posting — because, as covered above, your first-hour replies are more valuable than the scheduling feature itself. Buffer and Hypefury both surface early engagement notifications; generic schedulers that only auto-post add less value here.
If you're also building on LinkedIn alongside X, tools like LinkedIn engagement platforms serve the same function — real community response in the first engagement window — and the mechanics map closely to what makes X content perform.
Building engagement on LinkedIn too?
HyperClapper helps LinkedIn creators get real engagement from real people — no bots, no fake activity, just community-driven visibility.
See How HyperClapper WorksWhy Is My Twitter Engagement So Low — A Diagnostic Framework
Why is my Twitter engagement so low is one of the most searched questions from creators who have been grinding for 6–18 months without seeing results. The answer is almost always one of three things — and the fix depends entirely on which one applies to you.
A recurring pattern among creators trying to grow past their plateau is diagnosing a content problem when they actually have a distribution problem. Here's how to tell the difference:
Step 1 — Check your follower stage. Under 1,000 followers, low engagement is nearly always a distribution problem. The algorithm hasn't established your reach signal yet. Publishing better content won't fix this — building your reply presence on larger accounts will. Give it 4–6 weeks of consistent engagement before judging content quality.
Step 2 — Audit your reply-to-impression ratio across your last 30 tweets in X Analytics. If impressions look healthy (above 500 per tweet at under 5K followers) but replies are near zero, the content is being seen but isn't prompting response. That's a copywriting fix — specifically your hooks and CTAs. If impressions are also low, it's a distribution or timing issue.
Step 3 — Check audience interaction metrics. High profile clicks with low engagement is a specific signal: people are curious about who you are but aren't connecting with what you're saying. This typically means your bio and your content are signalling different things — you're attracting one audience and writing for another.
Step 4 — Check for organic decay patterns. Accounts that took a posting break of 2+ weeks, changed their content topic abruptly, or went through a follower purge typically see suppressed reach for weeks afterward. The algorithm re-evaluates your reach signal during gaps. Recovery requires 4–6 weeks of consistent engagement-first content — not a burst of posts, but steady daily engagement with your niche.
✓ The Twitter Engagement Diagnostic Checklist
- ☐Calculate your current engagement rate using impressions (not followers)
- ☐Compare your rate against the correct follower-tier benchmark, not the flat 0.5–1.5% average
- ☐Check your last 30 tweets for reply-to-impression ratio in X Analytics
- ☐Audit your first-line hooks — does each tweet prompt a reaction before the "show more" cut?
- ☐Add a specific, low-friction question to your next 10 tweets and track reply rate change
- ☐Reply to 3–5 larger accounts in your niche daily for 2 weeks and measure follower-to-engagement ratio shift
- ☐Be present for the first 60 minutes after every post to reply to early comments
The same principles that govern engagement on X apply on LinkedIn — and if you're building across both platforms, understanding how beating the LinkedIn algorithm without posting more works will look surprisingly familiar. Both platforms now reward reply depth over raw volume. Tools like HyperClapper are built specifically for LinkedIn creators who want that first-window engagement signal without manufacturing it artificially — real people engaging with real content through structured community channels.
Turn your LinkedIn posts into conversations — not broadcasts
HyperClapper connects you with real engagement communities so your LinkedIn content gets the first-window boost it needs to reach beyond your existing followers.
Start Boosting Your LinkedIn EngagementFrequently Asked Questions About Twitter Engagement Rate
How do I see my engagement rate on Twitter?
Open X Analytics at analytics.twitter.com, click on any individual tweet, and you'll see total impressions and total engagements side by side. Divide engagements by impressions and multiply by 100. For an account-wide view, the dashboard shows a 28-day summary of engagement rate across all posts.
Is a 20% engagement rate good on Twitter?
A 20% rate is unusual and typically signals a very small, highly engaged audience (under 300 followers), a single outlier post skewing averages, or inflated metrics from pods or bots. At 500+ followers, a consistent 20% average across 30+ tweets is extremely rare. Genuine strong performance at scale is 2–5%.
How can I get more engagement on Twitter without tweeting more often?
Focus on three things: rewrite your hooks so the first line prompts a reaction, add a specific question at the end of every tweet to invite replies, and spend 20–30 minutes daily replying to larger accounts in your niche. Reply depth drives algorithmic reach more than post volume in 2026.
What types of tweets get the most engagement?
Threads and reply-chain content consistently outperform single tweets in total reach because each new reply extends the algorithmic window. Counterintuitive claims, specific data points, and direct questions generate the highest reply rates. According to Sprout Social (2026), tweets with images perform comparably to video posts — format matters less than the first line.
Does engaging with other accounts help your own Twitter reach?
Yes — and it's one of the most underused tactics. Replying to high-engagement posts in your niche within 30 minutes of their publishing puts your handle in front of an active, relevant audience. Accounts that do this consistently for 4–6 weeks see measurable follower growth and improved follower-to-engagement ratio on their own posts.
Why do some tweets go viral while others get no engagement?
Viral tweets almost always have one of three things in common: they generate a strong first-hour engagement signal that triggers algorithmic amplification, they tap into a high-emotion topic (sports, crypto, politics, controversy), or they were seen and shared by one or more high-follower accounts early. Replicating virality is unreliable — but optimising for consistent first-hour reply depth makes viral events more probable over time.
What is the average engagement rate on Twitter in 2026?
The median average engagement rate twitter accounts see in 2026 is 1.11%, according to SociaVault's platform benchmark report — down 9% from the prior year. The average engagement rate on Twitter varies significantly by follower count and niche, with smaller accounts averaging 3–5% and large accounts typically below 1%. An average twitter engagement rate above 2% at any tier is considered strong.
What consistently separates accounts with real reach from accounts with impressive follower numbers is not any single tactic — it's the combination of first-hour engagement presence, reply-first content design, and consistent niche positioning. Accounts that get all three right see compounding reach over 8–12 weeks. Accounts that miss any one typically plateau regardless of how frequently they post.