The tools for twitter analytics that actually move the needle are rarely the ones most guides recommend — and the gap between what the native X dashboard shows you and what you actually need to know is wider than most creators realise. A pattern observed across high-performing X accounts is that they treat analytics not as a scoreboard but as a diagnostic tool: they use it to identify why something worked, not just that it worked. This guide covers what X analytics genuinely tells you, where it falls short, which tools fill those gaps (at what cost), and how to translate the numbers into a content strategy that compounds over time.
- The native X analytics dashboard is free but limited to 28 days of history and zero competitor data — knowing this upfront prevents misreading your own performance.
- Impressions and views are not the same metric, and conflating them is the single most common measurement mistake on X.
- Free third-party tools are genuinely useful for own-account tracking; competitor monitoring almost always requires a paid tier.
- Algorithm changes since 2023 have shifted what "good reach" looks like — benchmarks from older guides are now misleading.
- The most counterintuitive finding: engagement rate on individual posts matters more than follower count for predicting content distribution.
- B2B and B2C accounts need fundamentally different metric hierarchies — a single analytics approach for both leaves money on the table.
- What X Twitter Analytics Actually Tells You (And What It Doesn't)
- How to Track Tweet Performance Step by Step
- Best Twitter Analytics Tools in 2026: Free vs Paid, Honestly Compared
- Common Mistakes That Make Your X Analytics Misleading
- Turning X Analytics Into an Actual Content and Growth Strategy
- FAQ: X Twitter Analytics Questions Answered Honestly
What X Twitter Analytics Actually Tells You (And What It Doesn't)
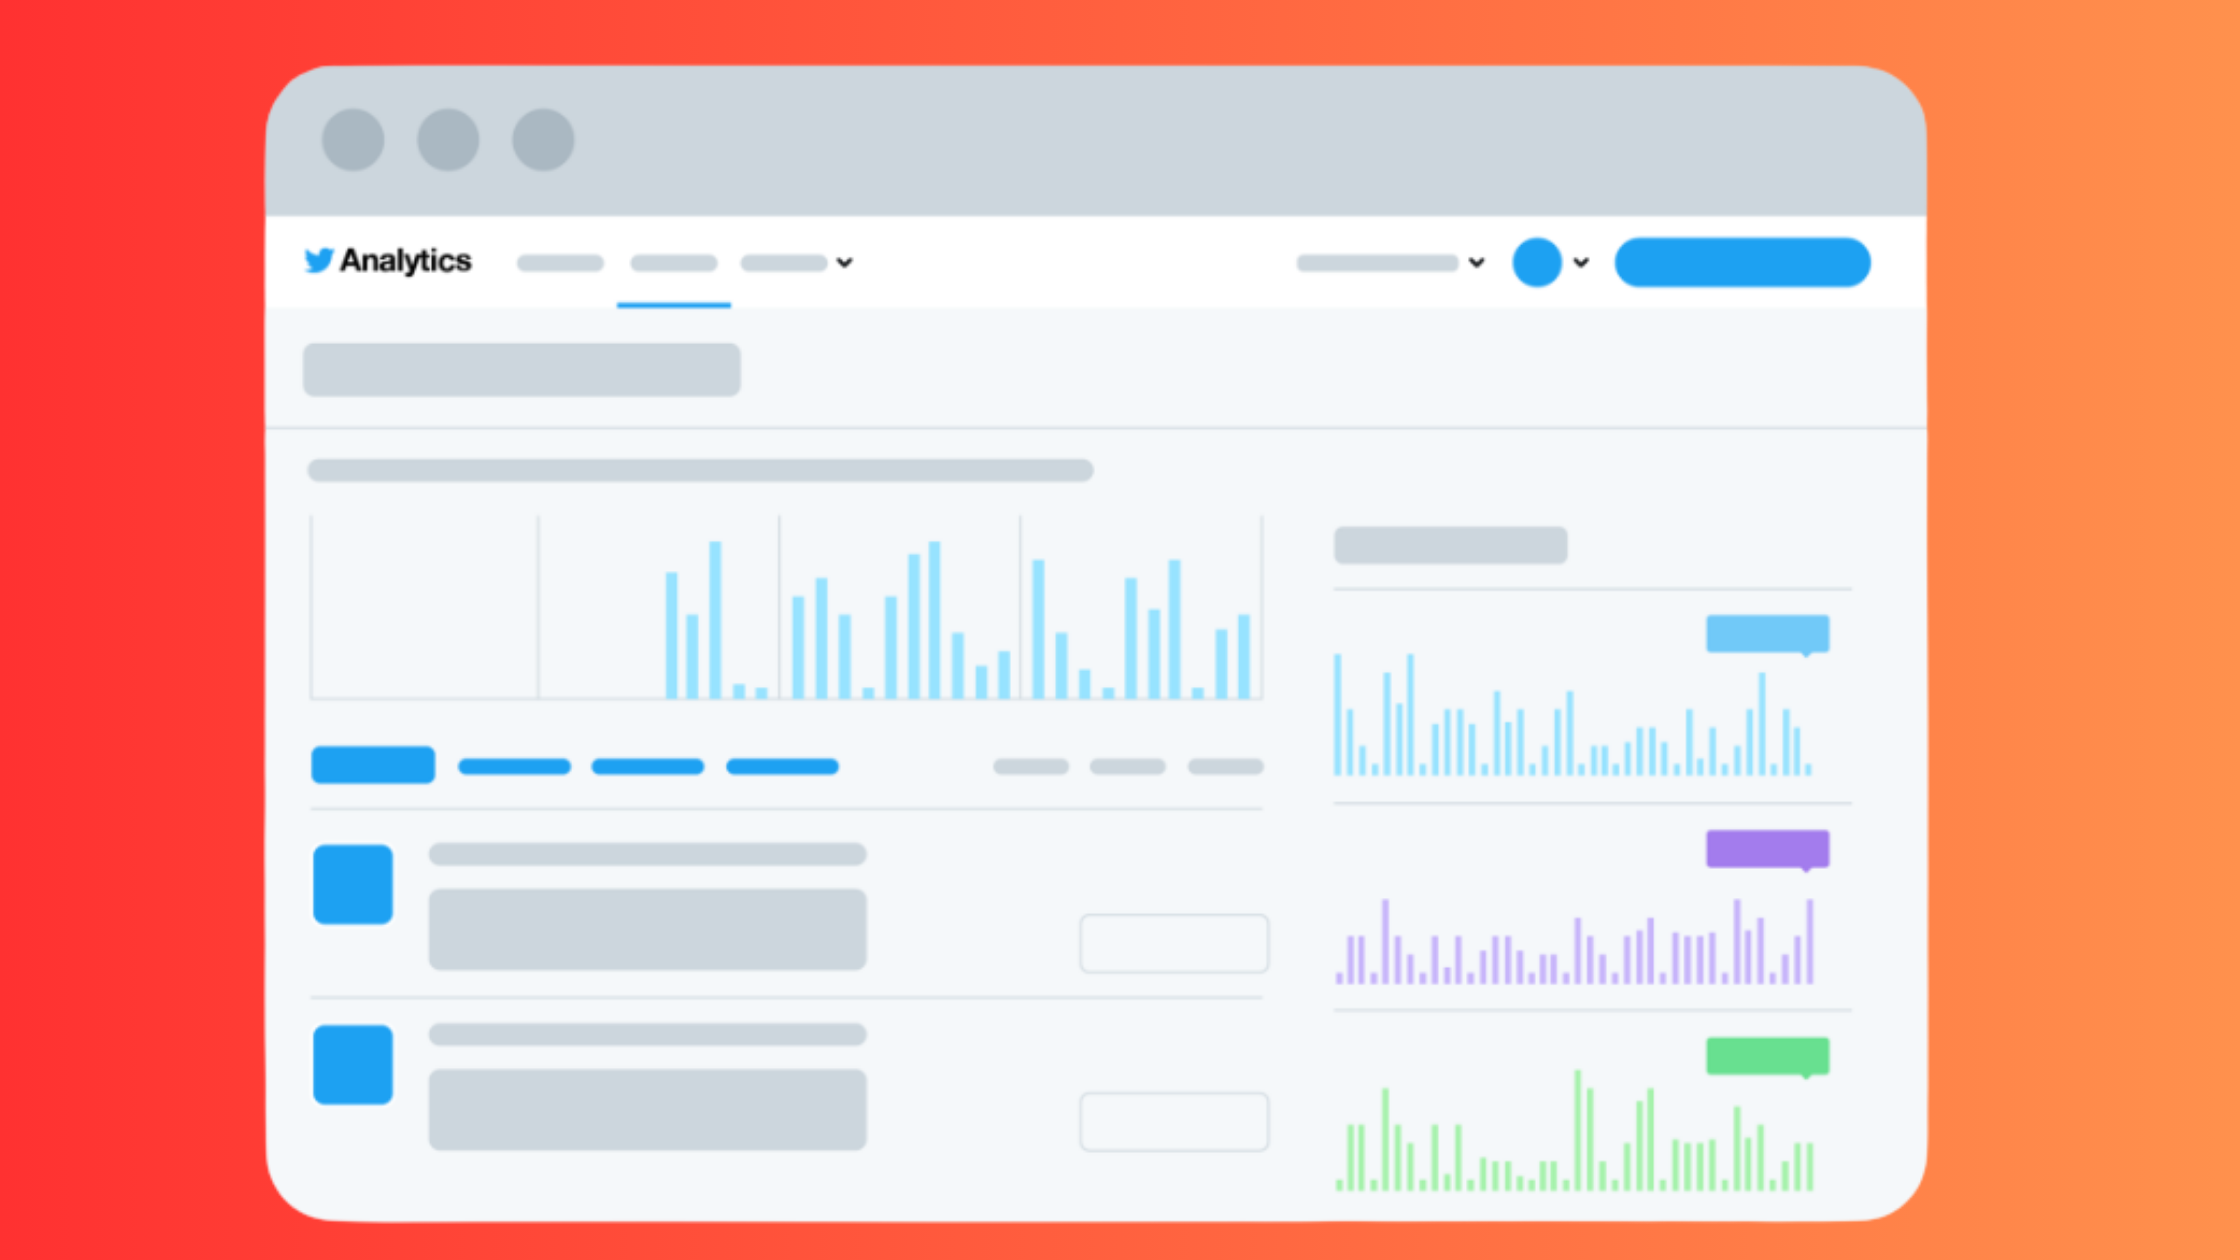
The X analytics dashboard — the twitter analytics dashboard accessible at analytics.twitter.com — is a free, built-in performance layer that surfaces impression counts, engagement totals, link clicks, profile visits, and follower change data for your own account. Free accounts get 28 days of rolling history; X Premium subscribers access up to 60 days in some views. What it does not show: any data about accounts you do not own, demographic breakdowns beyond geography and device type for free users, or anything resembling competitor account monitoring.
Understanding the limits upfront is the difference between using analytics as a decision tool and using it as a vanity mirror.
Twitter Impressions vs Reach: The Difference That Actually Matters
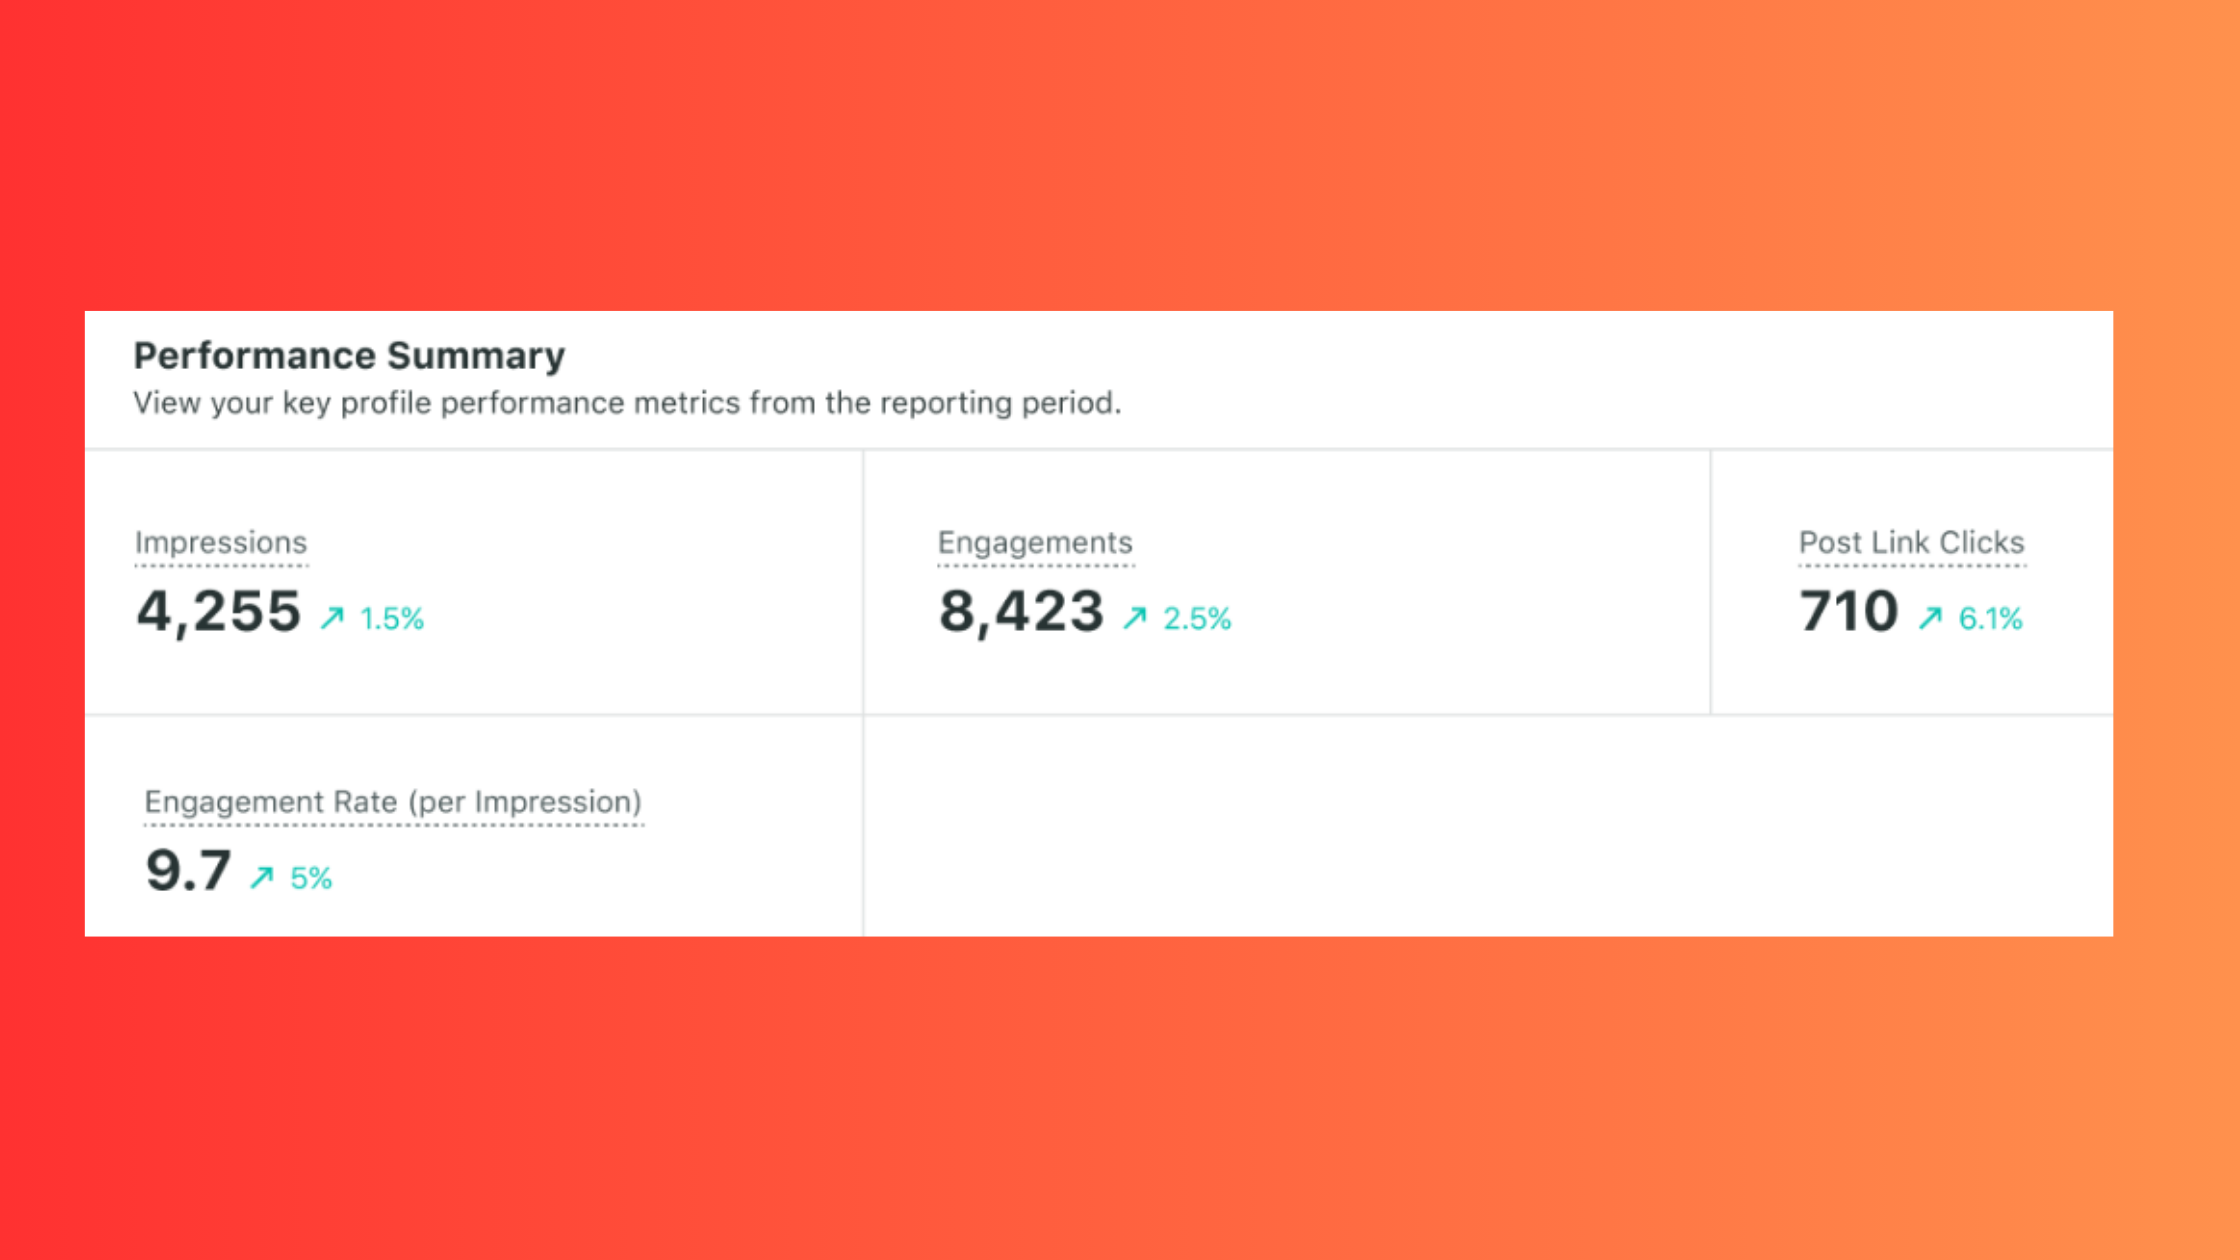
Twitter impressions vs reach is the most consistently misunderstood pairing in X analytics. Impressions count the total number of times a post was displayed — including multiple views by the same person. Reach (referred to as "views" in updated X terminology) represents unique accounts that saw the post. A post with 10,000 impressions might have reached 6,000 unique accounts — the gap widens when your existing followers see a post repeatedly via retweets and algorithmic re-serving.
In practice, impressions inflate when X's recommendation engine pushes a post beyond your followers. This matters because a spike in impressions without a corresponding lift in engagement rate often signals algorithmic distribution to cold audiences — interesting, but not a sign your content is resonating with the people most likely to convert into followers or customers.
What Is a Good Engagement Rate on X in 2026?
X analytics engagement rate is calculated as total engagements (likes, retweets, replies, link clicks, detail expands) divided by impressions. What qualifies as strong depends on account size: accounts under 10,000 followers typically see engagement rates between 1% and 3% on well-performing posts; larger accounts (50,000+) often settle in the 0.5%–1.5% range as reach extends to less-engaged audiences. A rate consistently below 0.5% is a signal worth investigating — it usually points to posting at the wrong time, misaligned content for the current audience, or link-heavy posts that X's algorithm deprioritises.
What consistently separates accounts with compounding reach from accounts that plateau is not posting frequency — it is engagement rate on early interactions. The first 30 minutes after posting determine distribution for the next 24 hours.
Now that you understand what the native dashboard measures — and where it stops — the next step is setting up a systematic way to actually track it.
How to Track Tweet Performance Step by Step
Tracking tweet performance well requires a baseline before it requires a tool. Teams that define their KPIs before opening analytics consistently make better decisions than those who let whatever metric appears on screen become the goal by default.
Here is the full process for how to track tweet performance:
- Access X analytics on desktop — Go to analytics.twitter.com while logged in. The 28-day summary view loads automatically. (30 seconds)
- Select a specific post — Click on any tweet in the Activity feed to open its individual metrics view, which shows link clicks, detail expands, profile clicks, and retweet breakdown separately. (1 minute)
- Record your baseline — Before drawing any conclusions, note your account's average engagement rate and average impressions per post over the last 30 days. Without a baseline, individual post numbers are meaningless. (5 minutes, done once per month)
- Define 2–3 KPIs aligned to your goal — Growing followers? Track follows-from-post. Building authority? Track profile visits. Driving traffic? Track link clicks. Avoid tracking everything — it leads to paralysis. (10 minutes, done once per quarter)
- Export post data to CSV — In the tweet activity dashboard, use the Export button to download post-level data. This is the only native way to see beyond 28 days by stitching monthly exports together. (2 minutes per month)
How Often Should You Check X Analytics?
Check post-level metrics 24–48 hours after publishing (to capture the bulk of distribution) and do a full account review weekly or bi-weekly. Daily checking creates noise — a bad day looks like a trend, a good day looks like success. Monthly exports for CSV stitching take about 10 minutes and give you the multi-month view the dashboard withholds.
X Analytics for Business Accounts: What's Different
An X analytics for business account setup differs primarily in access to the Ads Manager analytics layer, which surfaces audience insights and conversion tracking unavailable to personal accounts without an active ad spend. The organic analytics dashboard is structurally identical, but business accounts running promoted posts can separate organic from paid reach — a distinction that free organic analytics cannot make on its own.
Best Twitter Analytics Tools in 2026: Free vs Paid, Honestly Compared
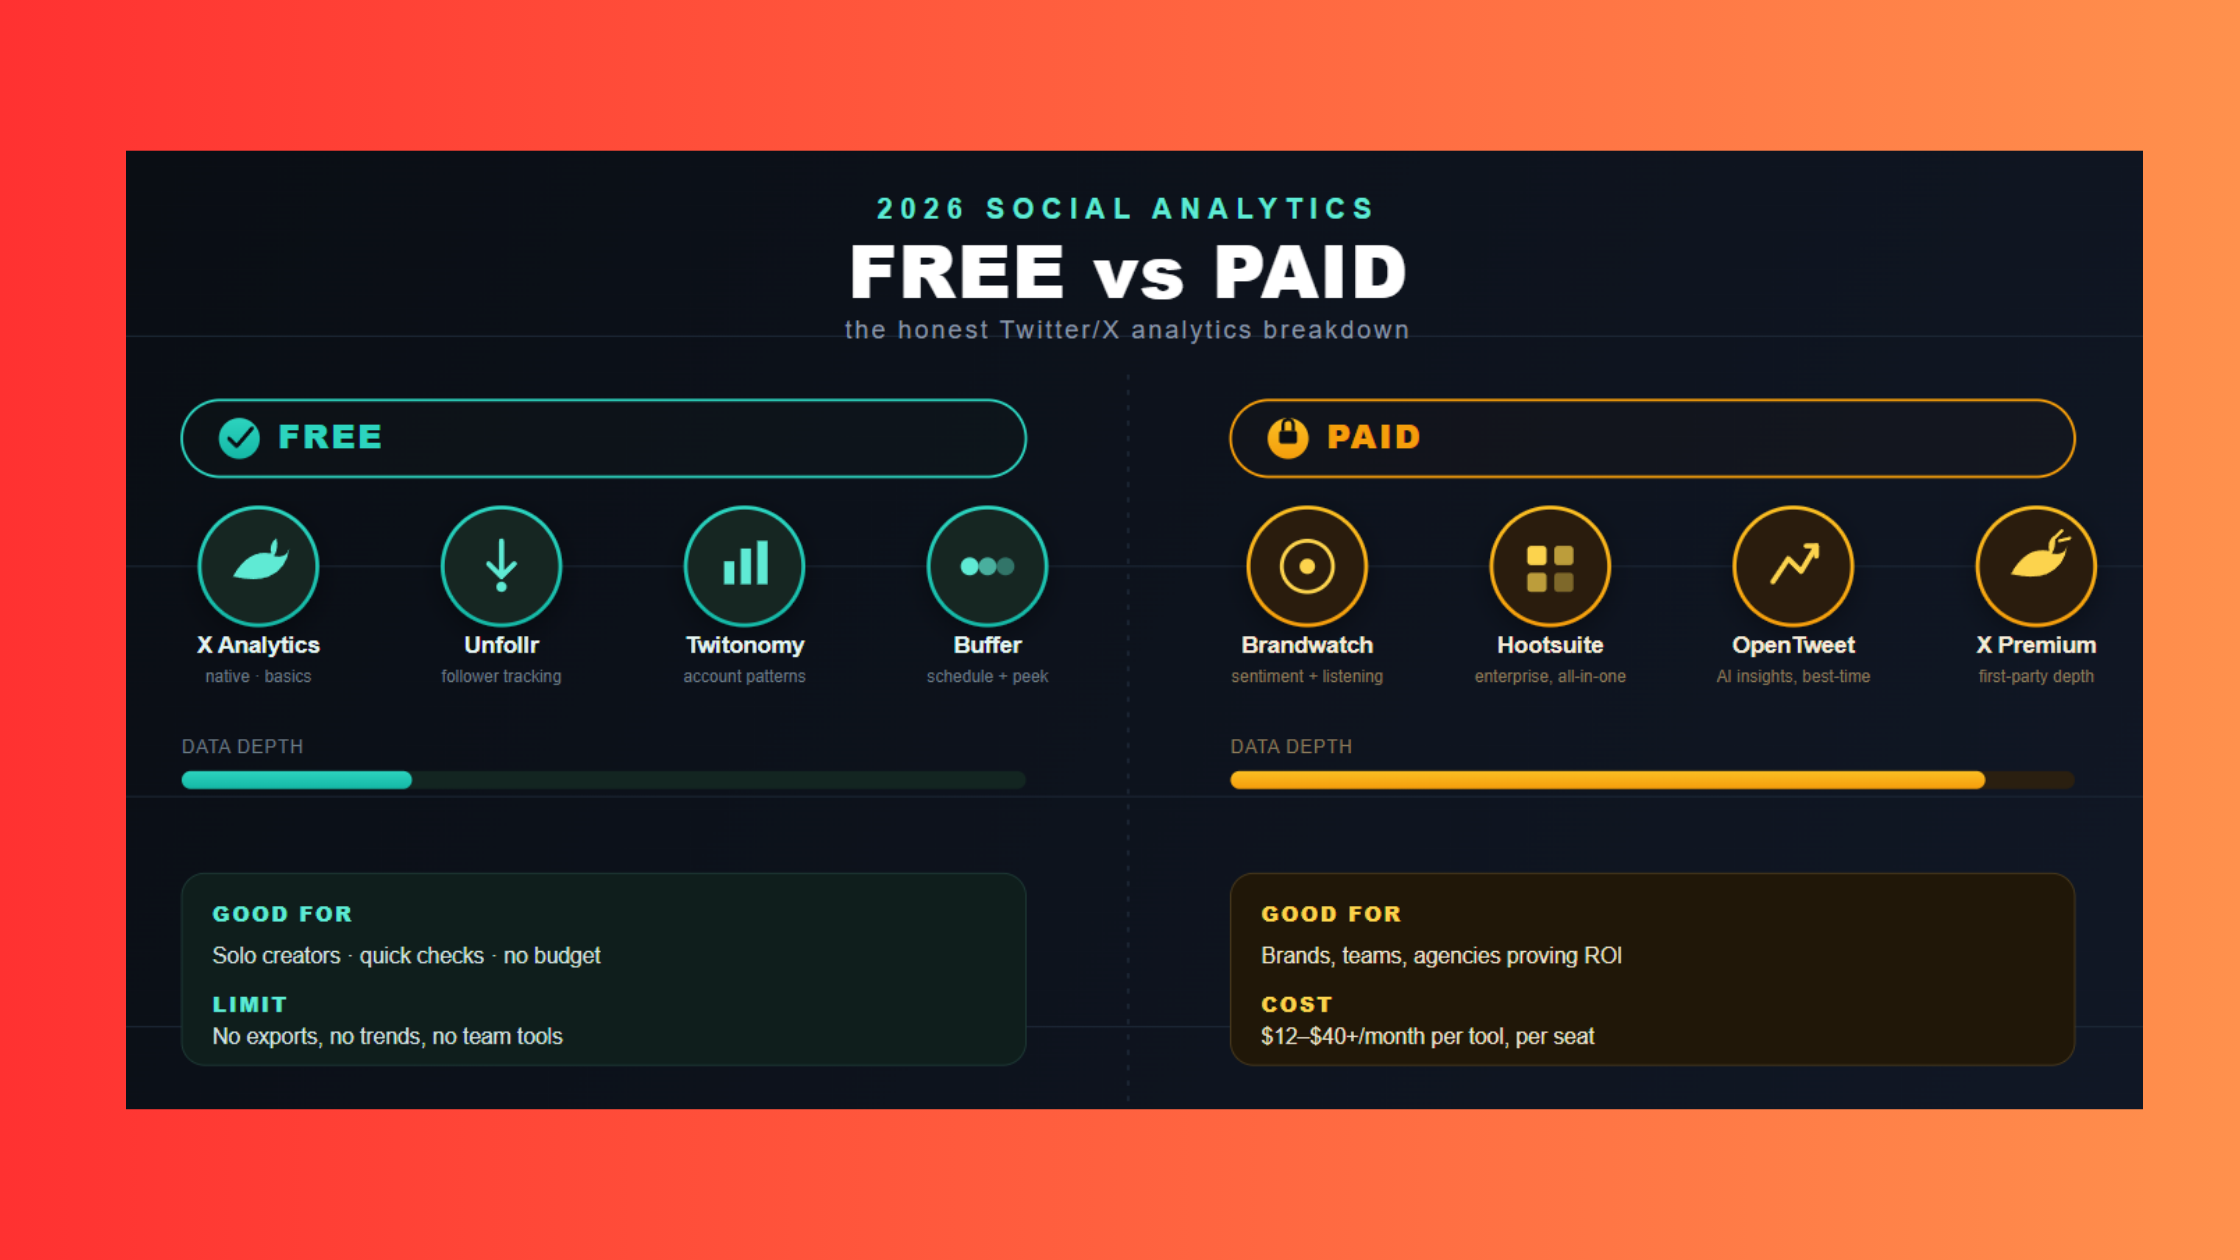
Across Reddit and Quora threads on X analytics, "free" appears as the dominant qualifier — not because professionals are unwilling to pay, but because the capability gap between free and paid tiers is poorly documented, and most guides list tools without being honest about where the walls are. Here is an honest use-case-segmented comparison of the best tools for twitter analytics.
| Tool / Option | Best For | Competitor Data? | Price | Free Tier Limit |
|---|---|---|---|---|
| Native X Dashboard | Own-account basics | No | Free | 28 days, no export API |
| Mentionlytics | Brand monitoring + competitor tracking | Yes (paid) | From ~$69/mo | Trial only |
| Sprout Social | Team reporting + audience demographics | Yes (paid) | From $249/mo | 30-day trial |
| OpenTweet | Scheduling + own-account analytics | Limited | Free tier available | Basic post stats |
| Typefully | Creator own-account growth tracking | No | Free + paid from $12.50/mo | Limited history |
X Analytics vs Third-Party Tools: Which One Do You Actually Need?
The honest answer to X analytics vs third party tools: use native X analytics if you only need to track your own account's recent performance and you are on a tight budget. Switch to a third-party tool the moment you need any of the following:
- Competitor account monitoring (zero native support)
- Data history beyond 28–60 days
- Posting time recommendations based on your specific audience's active hours
- Multi-account reporting for clients or agencies
- Automated reports you can send without exporting CSVs manually
A recurring pattern among marketers managing multiple clients is spending weeks trying to work around native dashboard limits with spreadsheets — before realising a $30–$70/month tool would have saved hours every week. The threshold is rarely "do I need more data" and almost always "how much is my time worth."
Twitter Analytics Tool Free vs Paid: A Honest Capability Breakdown
Free tiers of twitter analytics tool free vs paid options typically cover:
- Own-account post stats (impressions, likes, retweets)
- Basic follower growth trend
- Limited historical view (usually 7–30 days)
What sits firmly behind paid walls across virtually every tool:
- Competitor account analysis
- Historical data beyond 30 days
- Audience demographic breakdowns
- Data export for client reporting
- Hashtag and keyword tracking at scale
After the 2023 X API restructuring — which eliminated the free API tier and raised costs dramatically — several tools that previously offered generous free competitor tracking either removed those features entirely or moved them to expensive plans. According to Mentionlytics (2026), tools that tested X analytics replacements saw significant variation in data completeness post-API changes. This is the gap the X Twitter analytics guide landscape consistently glosses over.
According to Soax Research (2026), X had approximately 335.7 million monthly active users in 2024, down from a peak of 368.4 million in 2022. This means the total addressable audience for your content has shifted — and benchmarks based on 2022 data overstate what typical organic reach can achieve today.
Building on LinkedIn as well as X? Your analytics work shouldn't stop at one platform.
HyperClapper helps LinkedIn creators get real engagement, AI-powered replies, and stronger post visibility — without bots or fake activity.
See How HyperClapper WorksCommon Mistakes That Make Your X Analytics Misleading
Four mistakes account for the majority of misread performance data across the accounts observed on X. Each is avoidable — but only if you know to look for it.
Mistake 1: Conflating algorithmic boost with genuine audience interest. X's recommendation engine can surface a post to users well outside your follower base, inflating impression counts in ways that bear no relationship to whether your actual audience found the content relevant. Always check whether an impressions spike came with a corresponding engagement rate — if the rate dropped during the spike, the algorithm distributed your content to a cold audience.
Mistake 2: Using 2022–2023 benchmarks post-algorithm update. Algorithm changes on X from late 2023 onward shifted distribution priority toward replies, longer content formats, and time-on-page signals. What counted as strong organic reach before those changes is not the same benchmark today. Creators who skip recalibrating their baseline against current norms typically find their "performance" looks worse on paper than it actually is.
Mistake 3: Tracking follower count as a primary KPI. For B2B accounts using X for lead generation, follower count is a near-useless proxy. The metrics that connect to pipeline are link clicks, profile visits from specific posts, and follows triggered by a single piece of content. Teams that anchor on vanity metrics consistently underinvest in the content formats that actually drive those conversion-adjacent signals.
Mistake 4: Trusting a single third-party tool for competitor data without cross-referencing. Different tools pull from the same X API but display results differently based on how they cache, sample, and refresh data. A pattern seen across competitive analysis workflows is that two tools can show materially different follower or engagement totals for the identical competitor account. Cross-reference at least two sources before making strategic decisions based on competitor data.
Does X Analytics Show Who Viewed Your Profile?
Does X analytics show who viewed your profile? No — and this is a frequent source of confusion. X shows aggregate profile visit counts (how many times your profile was viewed in a period), but it does not reveal which specific accounts visited. X Premium subscribers get access to a limited "Profile Visitors" feature that shows some recent visitors, but this is not a complete list and is not available through the analytics dashboard itself. No third-party tool has access to this data either, since X's API does not expose individual viewer identity.
Understanding where your data has real gaps is as valuable as knowing what the data shows — which brings us to the most practical use of analytics: turning the numbers into decisions.
Turning X Analytics Into an Actual Content and Growth Strategy
Most professionals open their analytics, feel vaguely satisfied or concerned, then close the tab without changing anything. The accounts that grow use analytics operationally — as a feedback loop that directly informs what they publish next.
How to use X analytics to improve content: Pull your last 90 days of tweet data via CSV export (three monthly files). Sort by engagement rate — not total likes, not impressions. Your top 10% performing posts by engagement rate reveal three patterns worth reverse-engineering:
- Format: threads vs single posts vs image-led vs text-only
- Topic cluster: which subjects consistently outperform your average
- Posting time: whether your best-performing posts cluster in specific time windows
Posting schedule optimization based on this data beats generic "best time to post" advice because it reflects your audience's actual active hours, not a platform-wide average. Generic recommendations aggregate billions of accounts — your specific audience of 3,000 or 30,000 followers may peak at a completely different hour.
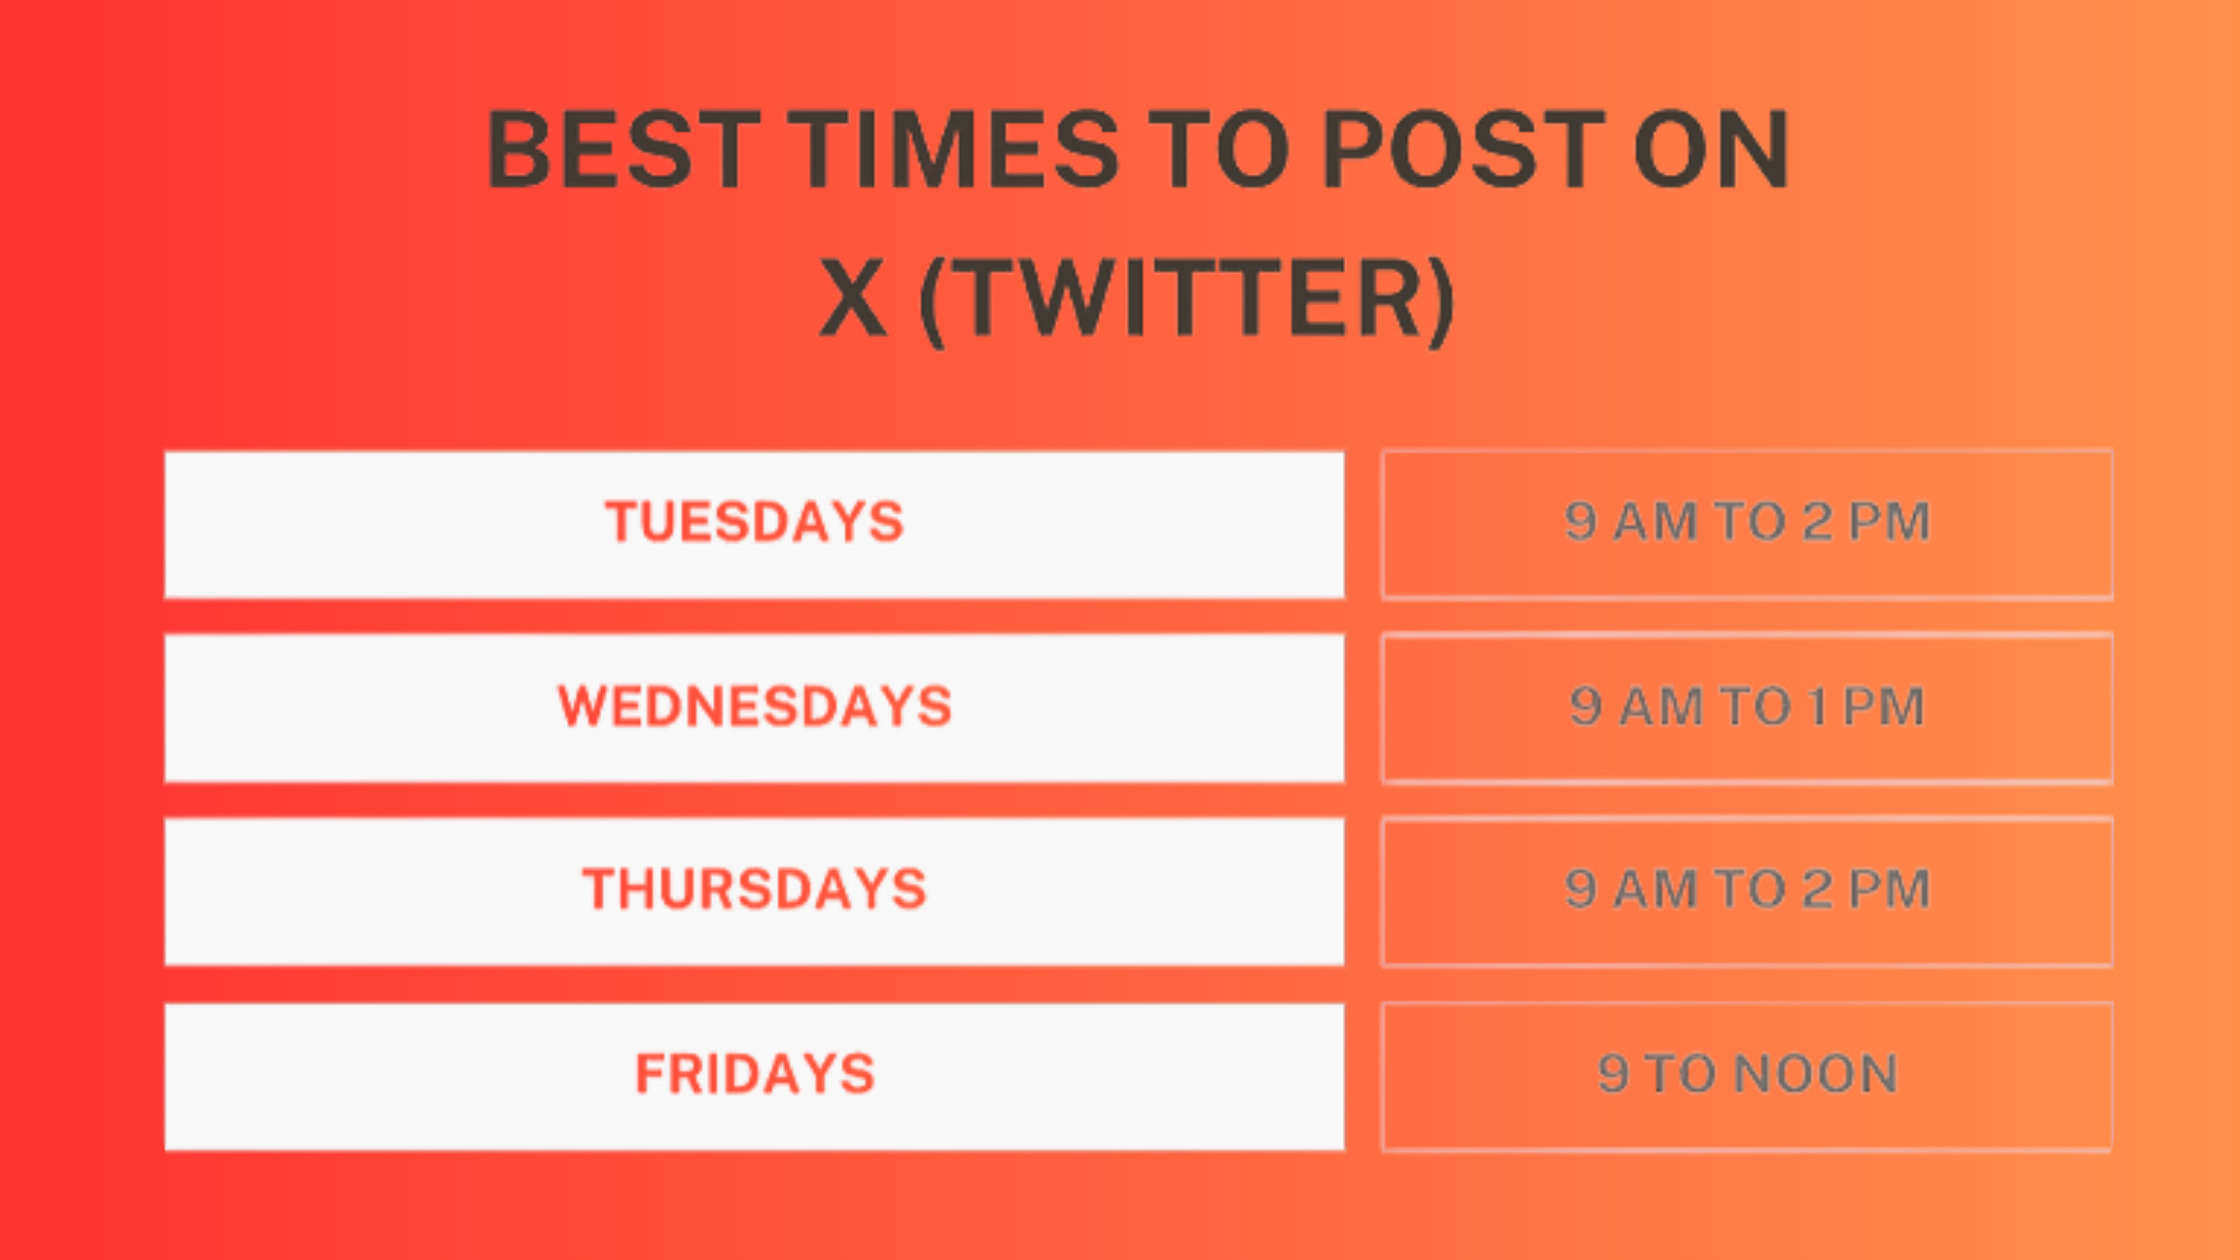
For B2B accounts specifically: the metrics that connect to business outcomes are profile visits per post and link clicks — not likes. A thread that gets 80 likes but drives 200 profile visits and 40 link clicks is worth five times as much as a post that gets 400 likes and zero profile activity. What separates top-performing B2B accounts on X is this metric hierarchy: they measure engagement as a means, not an end.
Historical data access: The native dashboard's 28-day limit is a real constraint for spotting multi-month trends. The workaround is simple: export monthly CSVs on the first of each month (takes two minutes), store them in a shared folder, and stack them in a spreadsheet quarterly. A basic AVERAGEIF formula on engagement rate by post format reveals trend lines the dashboard will never show you. HyperClapper's free tools offer a parallel approach for LinkedIn analytics — useful if you're running a cross-platform content strategy.
If you're also building your presence on LinkedIn alongside X, the approach to increasing LinkedIn reach without paid ads follows a similar data-first logic — know your baseline, identify your top-performing content patterns, and build systematically from there.
✓ Monthly X Analytics Review Checklist
- ☐Export this month's tweet activity CSV before the 28-day window rolls
- ☐Calculate your average engagement rate for the month (engagements ÷ impressions)
- ☐Identify top 3 posts by engagement rate (not raw likes) and note format + topic
- ☐Check profile visits trend — rising, flat, or falling vs last month
- ☐Identify the posting time window of your 3 best-performing posts
- ☐Update your content plan based on what the top-performers have in common
- ☐If running competitor analysis, cross-reference at least two third-party tool sources
Want the same data-first approach for your LinkedIn content?
HyperClapper gives LinkedIn creators real engagement, AI-powered replies, and post performance analytics — so your LinkedIn growth is as measurable as your X strategy.
Try HyperClapper FreeFrequently Asked Questions About X Twitter Analytics
What metrics should I focus on in X Twitter analytics to grow my account?
Focus on engagement rate (engagements ÷ impressions), profile visits per post, and follows gained from specific posts. These three metrics directly reflect whether your content is reaching the right people and compelling action — unlike impressions or follower count, which measure exposure without indicating quality or relevance.
What is the difference between impressions and views on X Twitter?
Impressions count every time a post is displayed, including repeat views by the same person. Views (reach) on X represent unique accounts that saw the post. A post with 8,000 impressions might have only 5,000 unique viewers — the gap is larger when the algorithm re-serves content to the same followers multiple times.
How do I know if my Twitter strategy is actually working using analytics?
Compare your average engagement rate, weekly profile visits, and monthly follower growth against your 90-day baseline. Strategy is working if all three trend upward together over 60+ days. A single good week is noise; six consecutive weeks of above-baseline performance is signal. Export monthly CSVs to track this beyond the 28-day dashboard limit.
How can I use X analytics to improve my content and posting schedule?
Sort your last 90 days of tweet data by engagement rate to find your top 10% performers. Identify shared patterns in format (thread vs single post), topic, and posting time. Publish more content matching those patterns and experiment with the posting times your best posts cluster around — not generic "best time" advice from industry blogs.
Why are my Twitter impressions low even when I post consistently?
Low impressions despite consistent posting usually trace to one of three causes: posting when your audience is offline (check your analytics for peak engagement windows), link-heavy posts that X's algorithm suppresses in distribution, or reply-first content that gets low early engagement signals. Try text-only posts at different times and compare impressions within 24 hours.
What are the real limitations of free X analytics tools compared to paid?
Free tools — including the native X dashboard — are limited to your own account data, typically 7–30 days of history, and no competitor monitoring. Paid tiers unlock competitor account analysis, historical data depth, audience demographic breakdowns, and automated reporting. After the 2023 API restructuring, competitor tracking specifically moved firmly behind paid walls across nearly every third-party tool.
Is x analytics free to access?
Yes — x analytics free access is available to all X accounts at analytics.twitter.com with no subscription required. You get 28 days of post performance data, basic impression and engagement metrics, and CSV export. X Premium extends some limits but the core dashboard is free for any verified or standard account.
What consistently separates accounts that genuinely grow from accounts that just generate activity is not access to more data — it is the discipline to act on a smaller set of the right metrics, track them consistently over time, and let the patterns emerge before drawing conclusions. The tools for twitter analytics that work best are the ones you actually review and respond to on a monthly cadence, not the ones with the longest feature list.