A pattern observed consistently across thousands of LinkedIn accounts is this: creators who understand exactly why their engagement rate is low fix it faster than those who simply post more. The LinkedIn engagement rate — calculated as (reactions + comments + shares + clicks) ÷ impressions × 100 — is the platform's clearest signal of whether your content actually connects with an audience. The 2026 average sits at 3.85% for personal profiles, according to ConnectSafely's 2026 LinkedIn Statistics report (citing Hootsuite and ContentIn data), with top-performing formats reaching up to 7%. Most accounts underperform that benchmark not because their content is bad, but because they misread the formula — and because LinkedIn's distribution algorithm is far less forgiving than most people realise.
- The correct LinkedIn engagement rate formula uses impressions as the denominator — not follower count — for an accurate efficiency read.
- The average LinkedIn engagement rate in 2026 is ~3.85%; personal profiles outperform company pages by 4–8× on average.
- LinkedIn's algorithm decides whether to expand a post's reach within the first 60–90 minutes — early engagement is disproportionately powerful.
- Engagement pods work when they deliver real, contextually relevant interactions; they fail when they produce generic likes and spam comments.
- HyperClapper channels seed that critical early engagement wave with real community members, not bots — addressing the most common reason posts underperform.
- The single most counterintuitive finding: posting less frequently (3–4×/week) often improves per-post engagement rate for accounts under 20K followers.
- LinkedIn Engagement Rate Benchmarks 2026
- Why Your LinkedIn Engagement Is So Low
- How HyperClapper Boosts LinkedIn Engagement Rate
- How to Improve LinkedIn Engagement Rate in 2026
- How to Calculate and Track Your LinkedIn Engagement Rate
- Frequently Asked Questions About LinkedIn Engagement Rate
What Is a Good LinkedIn Engagement Rate in 2026? (Benchmarks by Profile, Industry, and Format)
A good engagement rate on LinkedIn in 2026 depends heavily on whether you're running a personal profile or a company page — and the gap is wider than most people expect. Personal profiles average 2–4%, while company pages typically sit between 0.4–1%. Top creators and high-frequency posters regularly hit 5–8%, and Sprout Social's benchmark guide citing Social Insider data shows the platform-wide average by impressions reached 5.19% in mid-2025. What matters more than any single number: understanding which benchmark applies to you.
According to ConnectSafely's 2026 LinkedIn Statistics (aggregating Hootsuite and ContentIn data), the average engagement rate jumped 44% year-over-year — a signal that LinkedIn's algorithm has shifted toward rewarding genuine conversation over passive scrolling. In practice, this means the bar is rising: an engagement rate that felt solid in 2023 may now signal underperformance.
Personal Profile vs. Company Page Engagement Rate: The 2026 Gap
Personal profiles structurally outperform company pages by 4–8× in engagement rate linkedin terms, and it is not random. LinkedIn's algorithm trusts human voices more than brand accounts — people interact with people. According to LinkedIn research cited by Luke Brynley-Jones, roughly 30% of company page engagements come from employees — meaning large organisations inflate their own rates through internal audiences while smaller brands get almost no organic reach amplification.
Industry-specific spread matters too. According to Oktopost's April 2026 industry benchmark data, Manufacturing companies in the 201–500 employee band hit P90 engagement rates of 24.5% — outliers driven by niche, highly engaged audiences. B2B SaaS and recruitment accounts typically sit at 3–5%, B2C brands at 1–2%, and large enterprise pages at 0.3–0.8%.
What LinkedIn Engagement Rate Do Top Creators Actually Get?
The most useful linkedin engagement rate benchmark for top creators is 5–8% per post, with some niche accounts hitting double digits when their audience is small, loyal, and highly targeted. Follower count creates a ceiling effect: accounts under 1,000 followers regularly see 2–4% because every follower represents a genuine connection, while accounts with 50,000+ followers dilute their engagement rate simply by having a larger, less curated audience. The follower-adjusted benchmarks for 2026 make this clear:
- Under 1,000 followers: 2–4% is good
- 1,000–5,000 followers: 1.5–3% is good
- 5,000–10,000 followers: 1–2.5% is good
- 10,000+ followers: 0.5–1.5% still represents strong performance
Post format is an underrated lever. Document carousels and native video consistently outperform plain text or external-link posts by 2–3× in engagement rate. Format choice alone can move an account from average to top-quartile performance without changing the content strategy at all.
Why Your LinkedIn Engagement Is So Low (And What the Algorithm Is Actually Rewarding)
The most common failure mode among creators asking "why is my LinkedIn engagement so low" is not bad content — it is bad timing and no early activation. LinkedIn uses a multi-stage distribution model: every post first reaches a small seed audience (roughly 1–5% of followers), and the algorithm monitors engagement signals in the first 60–90 minutes to decide whether to amplify further. If that window passes quietly, the post is algorithmically buried — regardless of how good it is.
A post that earns no comments in the first 90 minutes is quietly buried by LinkedIn's algorithm, regardless of follower count or content quality. Early engagement is not a vanity metric — it is the distribution mechanism.
How LinkedIn Algorithm Engagement Signals Reward or Penalize Your Posts
LinkedIn algorithm engagement signals — the data points LinkedIn's distribution engine weighs — go well beyond simple like counts. Content dwell time (how long a viewer spends reading before scrolling past), comment depth (replies to replies), saves, and profile clicks all feed into the algorithm's relevance score. Passive likes are the weakest signal. Substantive comments that trigger replies are the strongest.
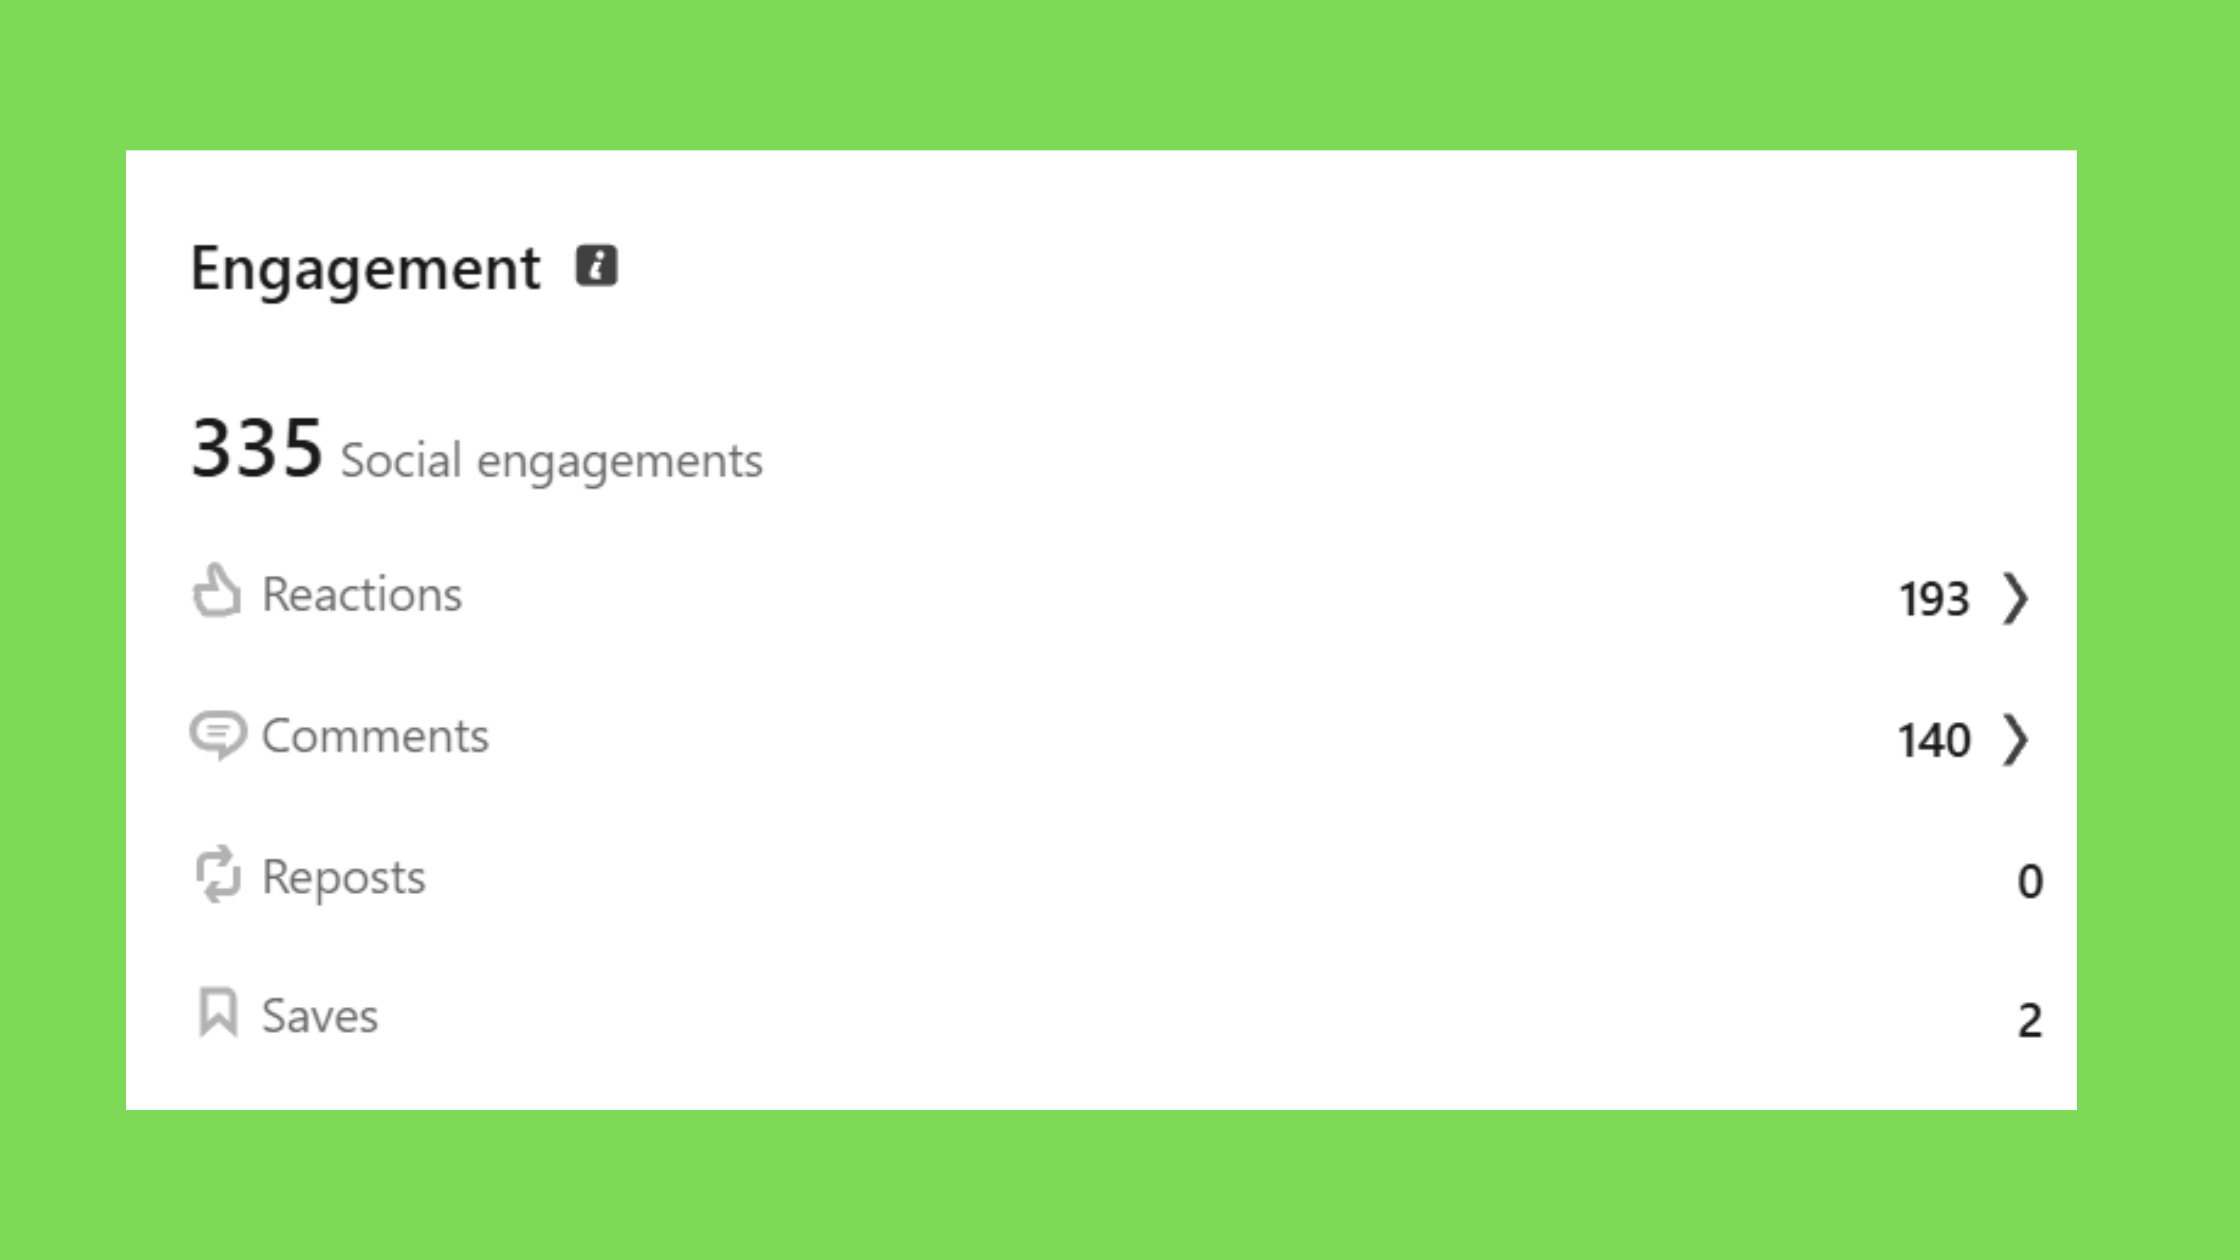
Social proof velocity is the rate at which a post accumulates engagement in its first hour — and it acts as the algorithm's primary trigger for reach expansion. Think of it as a launch signal: a post that gets 10 meaningful comments in the first 30 minutes tells the algorithm "this content is generating real conversation," and the system expands distribution. A post that gets nothing tells it the opposite.
Teams that protect the first 90 minutes — by scheduling posts when their audience is active, by responding to every early comment, and by pre-seeding engagement through channels — consistently see 2–3× the reach of equivalent posts left to perform organically. The content is identical. The activation is different.
How HyperClapper Boosts LinkedIn Engagement Rate: Features, Mechanism, and Real Results
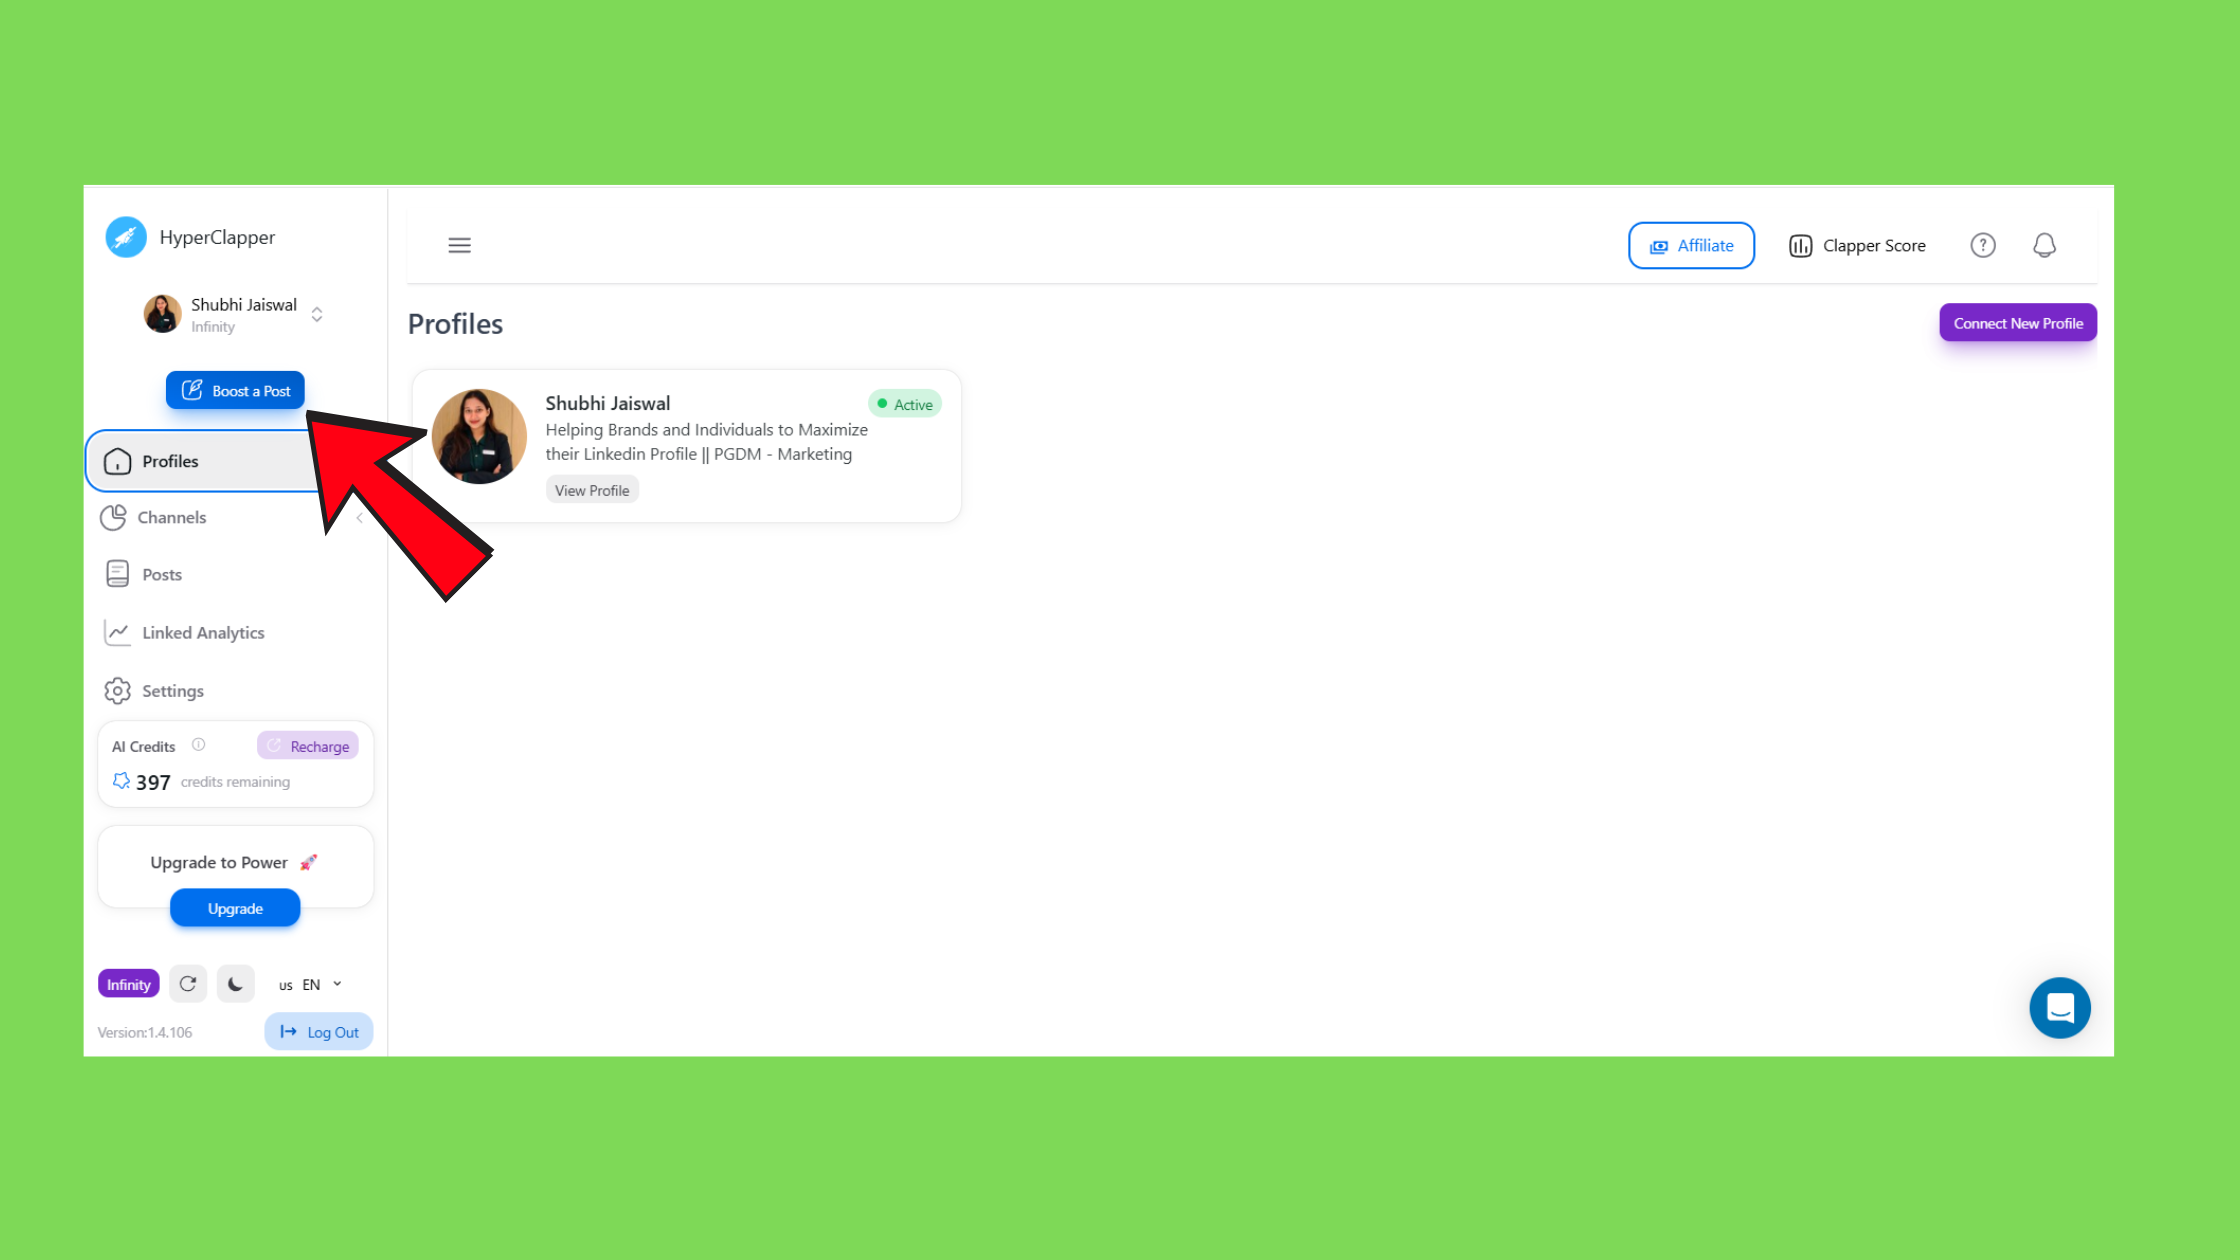
Forty-eight hours after a post goes live, most creators have accepted its fate. HyperClapper is built around a different premise: that the engagement window is not closed until you close it. The platform's channel system connects users with real, curated communities who engage with posts — 1 channel delivers approximately 50 possible engagements, 3 channels approximately 150 — creating the early social proof velocity that LinkedIn's algorithm uses to decide whether to expand reach.
This directly addresses the mechanism described above. When a post is boosted through HyperClapper channels immediately after publishing, the seed audience sees a post that already has engagement — which makes them more likely to engage themselves (audience quality score improves because real signals from real people make the content look relevant). The algorithm then sees organic momentum and amplifies further. It is a compounding effect, not a one-time boost.
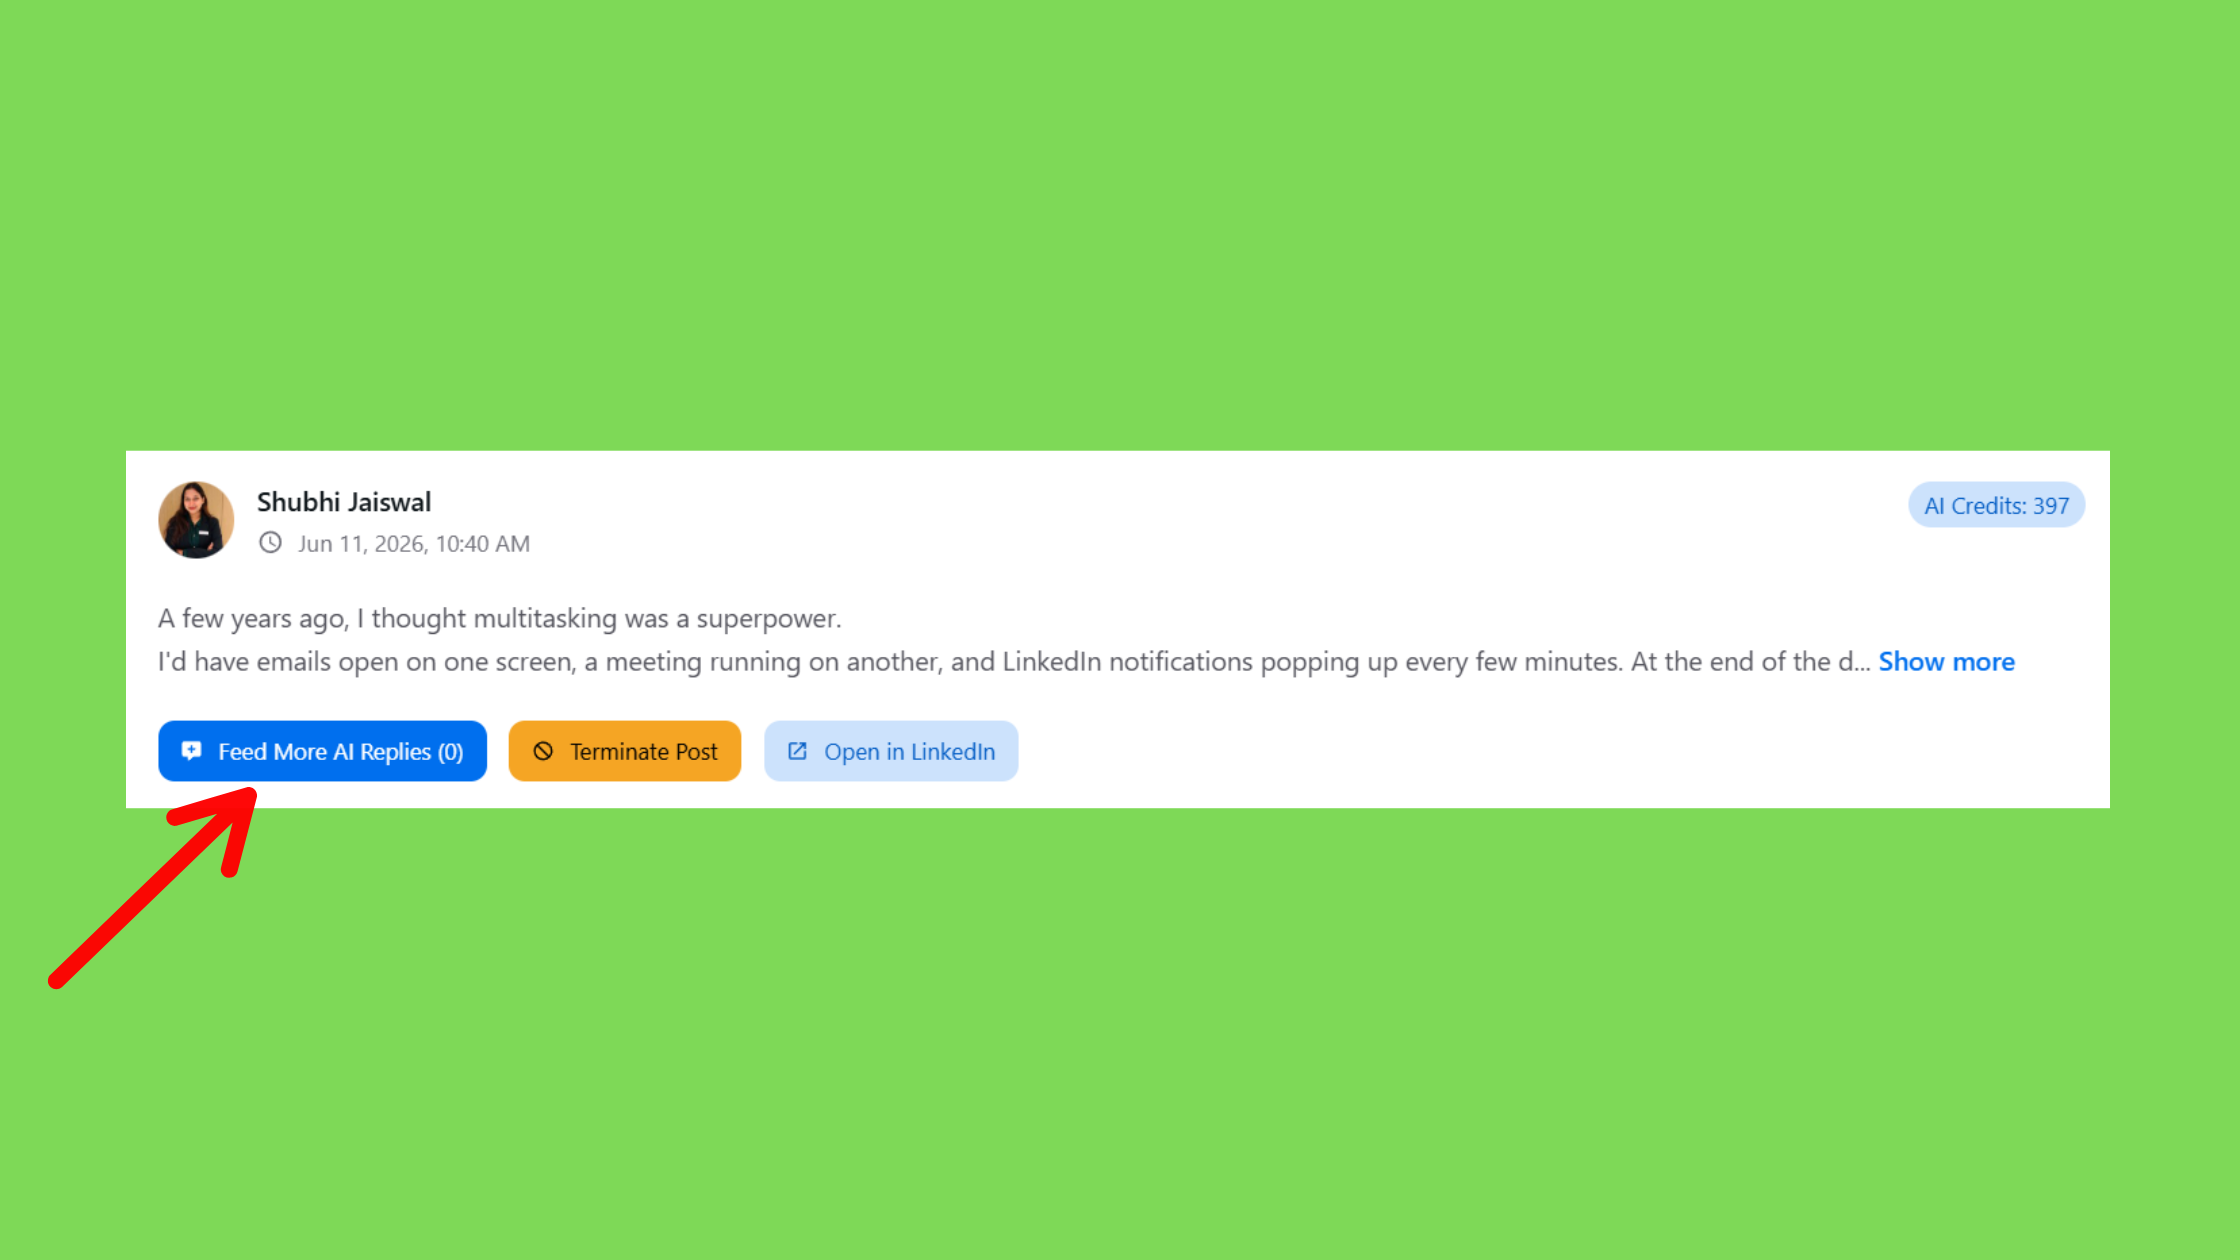
The AI Replies feature adds the layer that most LinkedIn engagement pod tool alternatives miss: substantive, contextually relevant comments rather than generic one-liners. LinkedIn's algorithm specifically rewards comment depth — replies that generate further replies signal a genuine conversation, not manufactured social proof. The "Feed More AI Replies" feature extends that momentum days after publishing, particularly valuable because LinkedIn can re-surface posts showing renewed engagement activity.
Do LinkedIn Engagement Pods Actually Work? Risks, Limitations, and What Makes HyperClapper Different
The answer to "do LinkedIn engagement pods actually work" depends entirely on what the pod delivers. Traditional pods — Slack groups where members drop their links and everyone likes in rotation — work mechanically but fail strategically. The engagements are generic, the comments are shallow, and LinkedIn's algorithm increasingly deprioritises engagement that looks coordinated and inauthentic.
What separates top-performing engagement tools from average ones is the quality and relevance of the engagement they generate. HyperClapper vs. LinkBoost is a useful comparison: LinkBoost operates on volume, HyperClapper on relevance and safety. HyperClapper's Content Guard moderation system filters out sensitive or controversial content before it ever enters a channel — protecting both the poster and the community from engagement that could trigger platform review.
Seed your next post's engagement before you hit publish
HyperClapper channels connect you with real professionals who engage with your content — giving your posts the early momentum LinkedIn's algorithm rewards.
Try HyperClapper FreeHow to Improve LinkedIn Engagement Rate: Practical Strategies That Work in 2026
Improving your average LinkedIn post engagement rate is a systems problem, not a creativity problem. Creators who lift their engagement rate sustainably do three things differently: they protect the first 90 minutes, they choose formats strategically, and they build a warm audience before they need it.
The The Engagement-First Method — the framework that separates consistently high-performing LinkedIn accounts from those that plateau — works like this:
- Publish at peak audience hours (Tuesday–Thursday, 8–10 AM local time for most B2B audiences) to maximise the seed audience quality.
- Activate channels immediately via HyperClapper to seed the first wave of engagement within the algorithm's critical 60-minute window.
- Respond to every early comment personally — this extends comment threads, adds dwell time, and signals genuine conversation depth to LinkedIn's algorithm.
- Ask one clear question in the post body — posts with a specific, answerable question receive roughly 3× more comments than posts that make statements alone.
- Use native content formats — no external links in body copy, document carousels or native video over plain text, 3–5 relevant hashtags maximum.
The posting frequency insight is counterintuitive: increase LinkedIn post reach organically not by posting daily, but by posting 3–4 times per week with higher quality. For accounts under 20K followers, daily posting competes with your own content for audience attention and dilutes per-post engagement rate. Less frequency, more intentionality per post, is the better strategy.
HyperClapper vs. Other LinkedIn Engagement Tools: Which Is Best in 2026?
When comparing the best LinkedIn engagement tool 2024 options that have carried into 2026, the differentiation comes down to three factors: engagement quality, safety architecture, and feature depth. Here is how the main contenders compare:
| Tool | Engagement Type | AI Replies | Safety Controls | Company Page Support |
|---|---|---|---|---|
| HyperClapper | Real community + AI replies | ✓ Contextual AI | Content Guard + moderation | ✓ Full support |
| Podawaa | Pod-based rotation | Limited | Basic | Limited |
| LinkBoost | Volume-focused | ✗ | Minimal | Partial |
| Lempod | Pod rotation | ✗ | Basic | ✗ |
For a deeper breakdown, see the full comparison of the top 5 LinkedIn engagement pods. For content creators and founders focused on building genuine visibility, HyperClapper's combination of real community engagement and contextual AI replies is the strongest choice — because it addresses the algorithm's actual quality signals, not just the surface metrics.
How to Calculate and Track Your LinkedIn Engagement Rate (With Benchmarks to Compare Against)
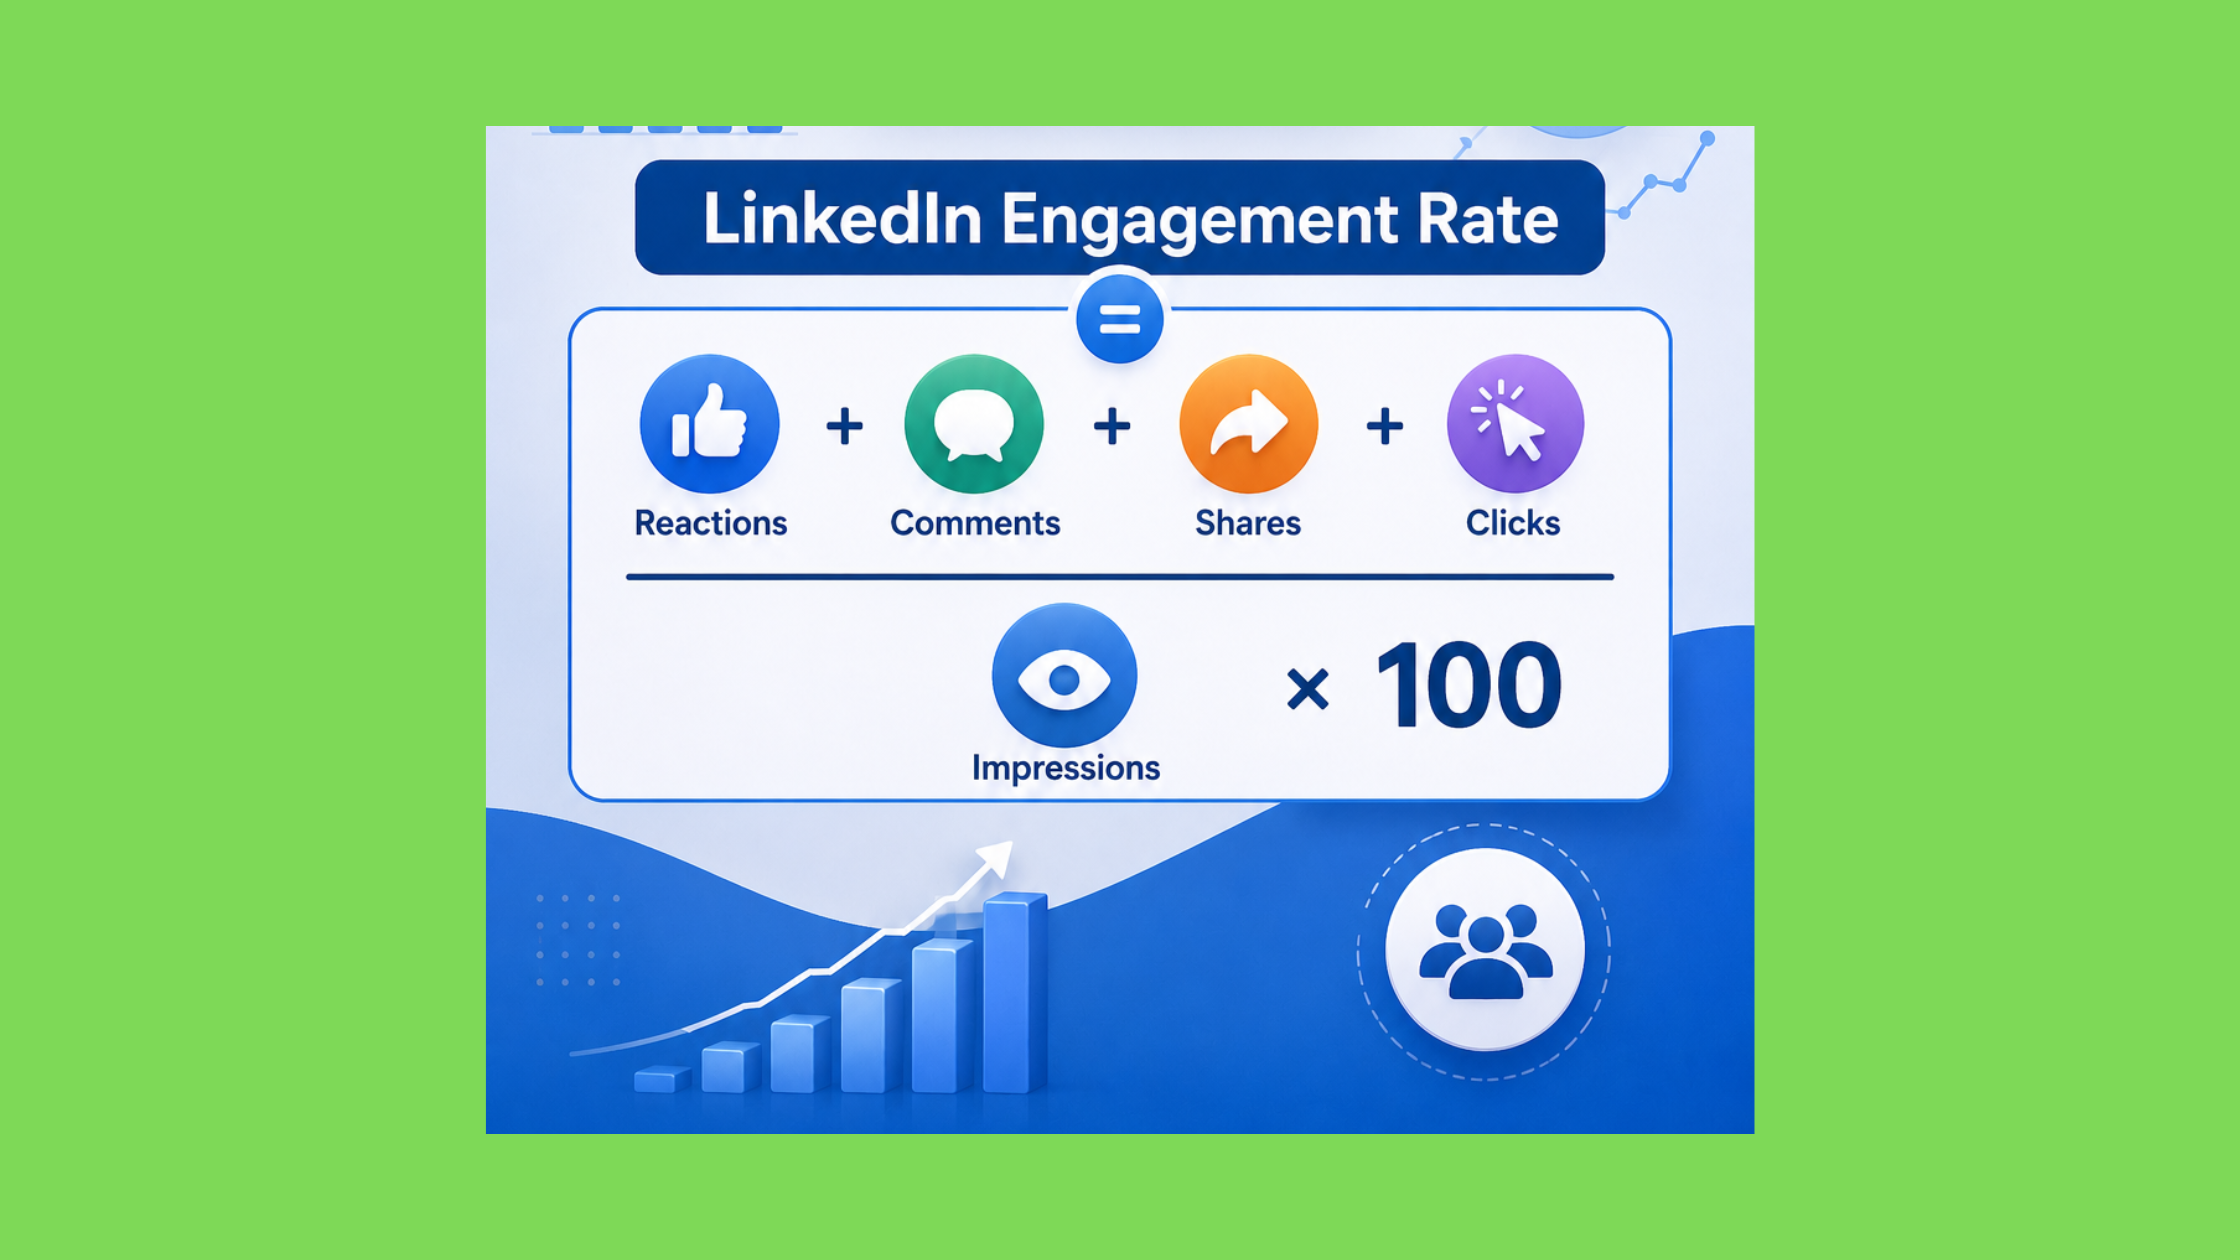
The linkedin engagement rate formula most people use is wrong — and it consistently produces inflated numbers that lead to false confidence. Here is the correct version:
LinkedIn Engagement Rate = (Reactions + Comments + Shares + Clicks) ÷ Impressions × 100
Use impressions as the denominator — not follower count. Impressions reflect actual eyeballs on the post; follower count does not.
Impressions is the total number of times your post was displayed, including repeat views. Reach is the number of unique viewers. LinkedIn's native analytics reports impressions, not reach, so use impressions consistently across all your tracking to avoid inflated or deflated calculations. This is the answer to "how is linkedin engagement rate calculated" — and getting the denominator right is the single most common correction needed when diagnosing underperformance.
How to Use a LinkedIn Engagement Rate Calculator
A linkedin engagement rate calculator automates this formula: input your reactions, comments, shares, clicks, and impressions from LinkedIn's native analytics, and the tool outputs your rate. LinkedIn's analytics dashboard provides all these figures per post — navigate to My Posts under Analytics on your profile to access them. This is also the direct answer to "how to calculate engagement rate on linkedin" natively.
For trend tracking rather than one-off calculations, HyperClapper's built-in analytics tracks engagement rate across posts over time, which is significantly more useful than point-in-time calculations. A single post's rate tells you very little; a 30-day trend tells you whether your strategy is working.
✓ The LinkedIn Engagement Rate Tracking Checklist
- ☐Use impressions (not follower count) as your denominator in every calculation
- ☐Include reactions, comments, shares, AND clicks — not just likes
- ☐Benchmark against the correct peer set (personal profile vs. company page, follower tier)
- ☐Track at 30-day rolling intervals, not post-by-post in isolation
- ☐Log engagement rate by post format (text, carousel, video) to identify your highest-performing type
- ☐Compare your 30-day average against the 2026 benchmark for your follower tier
- ☐Use HyperClapper analytics to track trends automatically rather than calculating manually each week
Stop guessing. Start tracking what actually moves your engagement rate.
HyperClapper's analytics dashboard tracks your LinkedIn engagement rate trends automatically — so you can see what is working and double down on it.
Explore HyperClapper FeaturesFrequently Asked Questions About LinkedIn Engagement Rate and HyperClapper
What is a good engagement rate for LinkedIn in 2026?
A good engagement rate on LinkedIn in 2026 is 2–4% for personal profiles and 0.5–1% for company pages. Top creators consistently hit 5–8%. The right benchmark depends on your follower count — accounts under 1,000 followers should target 2–4%, while accounts over 10,000 should aim for 0.5–1.5% as a healthy baseline.
What is the average engagement rate on LinkedIn and how can I beat it?
The average LinkedIn engagement rate in 2026 is approximately 3.85%, up 44% year-over-year according to ConnectSafely's 2026 statistics report. To beat it: use the Engagement-First Method — protect the first 90-minute window, use channels to seed early engagement, respond to every comment, and choose high-performing formats like carousels or native video.
Is 7% engagement good on LinkedIn?
Yes — 7% is strong performance by 2026 standards, placing you in the top tier of personal profile creators. It typically indicates a small, highly engaged audience or a viral post. For accounts above 10,000 followers, consistently hitting 7% would be exceptional; for accounts under 2,000, it is achievable with strategic community activation.
How to check LinkedIn engagement rate and does HyperClapper track it for you?
To check your LinkedIn engagement rate natively, go to your profile, click Analytics, then My Posts — LinkedIn shows impressions, reactions, comments, and shares per post. Divide total engagements by impressions and multiply by 100. Yes, HyperClapper's analytics dashboard tracks this automatically across posts over time, making trend analysis much simpler.
Can an engagement pod tool genuinely improve my LinkedIn reach?
Yes — when it delivers real, contextually relevant engagement. Tools that generate authentic early comments and reactions trigger LinkedIn's algorithm to expand distribution, resulting in 2–3× the reach of un-boosted posts. Tools that produce generic likes or bot-generated comments deliver minimal algorithmic benefit and carry higher platform risk.
How does HyperClapper compare to manual LinkedIn engagement strategies?
Manual strategies — commenting in engagement groups, reciprocal liking — work but require 5–10 hours per week and produce inconsistent early-window results. HyperClapper automates the early activation phase through channels and AI replies, achieving equivalent or better social proof velocity in minutes rather than hours, while its Content Guard system reduces the moderation risk of manual group participation.
What LinkedIn engagement metrics should I track to measure success?
Track engagement rate (by impressions), comment depth (replies-to-comments ratio), profile visits per post, and follower growth rate. Engagement rate and comment depth are the strongest algorithm signals. Profile visits show whether content is driving real audience interest. Track these monthly at minimum — weekly for active growth campaigns using tools like HyperClapper's built-in analytics.
What is a good engagement rate specifically for B2B vs B2C LinkedIn accounts?
B2B accounts — particularly SaaS, recruitment, and professional services — typically benchmark at 3–5% for personal profiles and 0.5–1.5% for company pages. B2C brand pages generally sit lower at 1–2%, partly because their audiences are less professionally invested in the content. B2B outperforms B2C on LinkedIn specifically because the platform's professional context makes B2B content intrinsically more relevant.
After seeing this pattern across high-performing and underperforming LinkedIn accounts alike, the conclusion is consistent: what separates accounts that beat the average linkedin engagement rate benchmark from those that plateau at mediocrity is not content quality alone — it is the combination of understanding the algorithm's early-window mechanics, choosing the right formats, and building the kind of community activation that makes the first 90 minutes count. Accounts that get all three right see compounding reach. Accounts that miss any one typically stall, regardless of how hard they post.