.png)

LinkedIn analytics tools are software platforms that collect, visualize, and interpret performance data from your LinkedIn profile, company page, and content — turning raw numbers into decisions you can act on. A pattern observed across high-performing LinkedIn accounts is that the professionals growing fastest aren't posting more often, they're posting smarter: using data to identify what resonates, who's seeing it, and whether it's moving the right people to act. Native LinkedIn analytics gives you a starting point, but third-party tools are what close the gap between "I think this is working" and "I know this is working."
LinkedIn analytics tools are platforms — either native to LinkedIn or built by third parties — that aggregate your profile and content performance data, then surface it in dashboards designed for decision-making. The core value isn't the numbers themselves. It's the patterns inside those numbers: which content type drives profile visits, which audience segment is actually engaging, and whether your growth is compounding or plateauing.
LinkedIn's built-in dashboard has improved, but it still carries three structural limitations that frustrate serious users:
In 2026, LinkedIn growth analytics isn't optional for anyone serious about building visibility or generating pipeline on the platform. According to LinkedIn's own published data, the platform has over 1 billion members — meaning organic reach without a data feedback loop is essentially guesswork at scale.
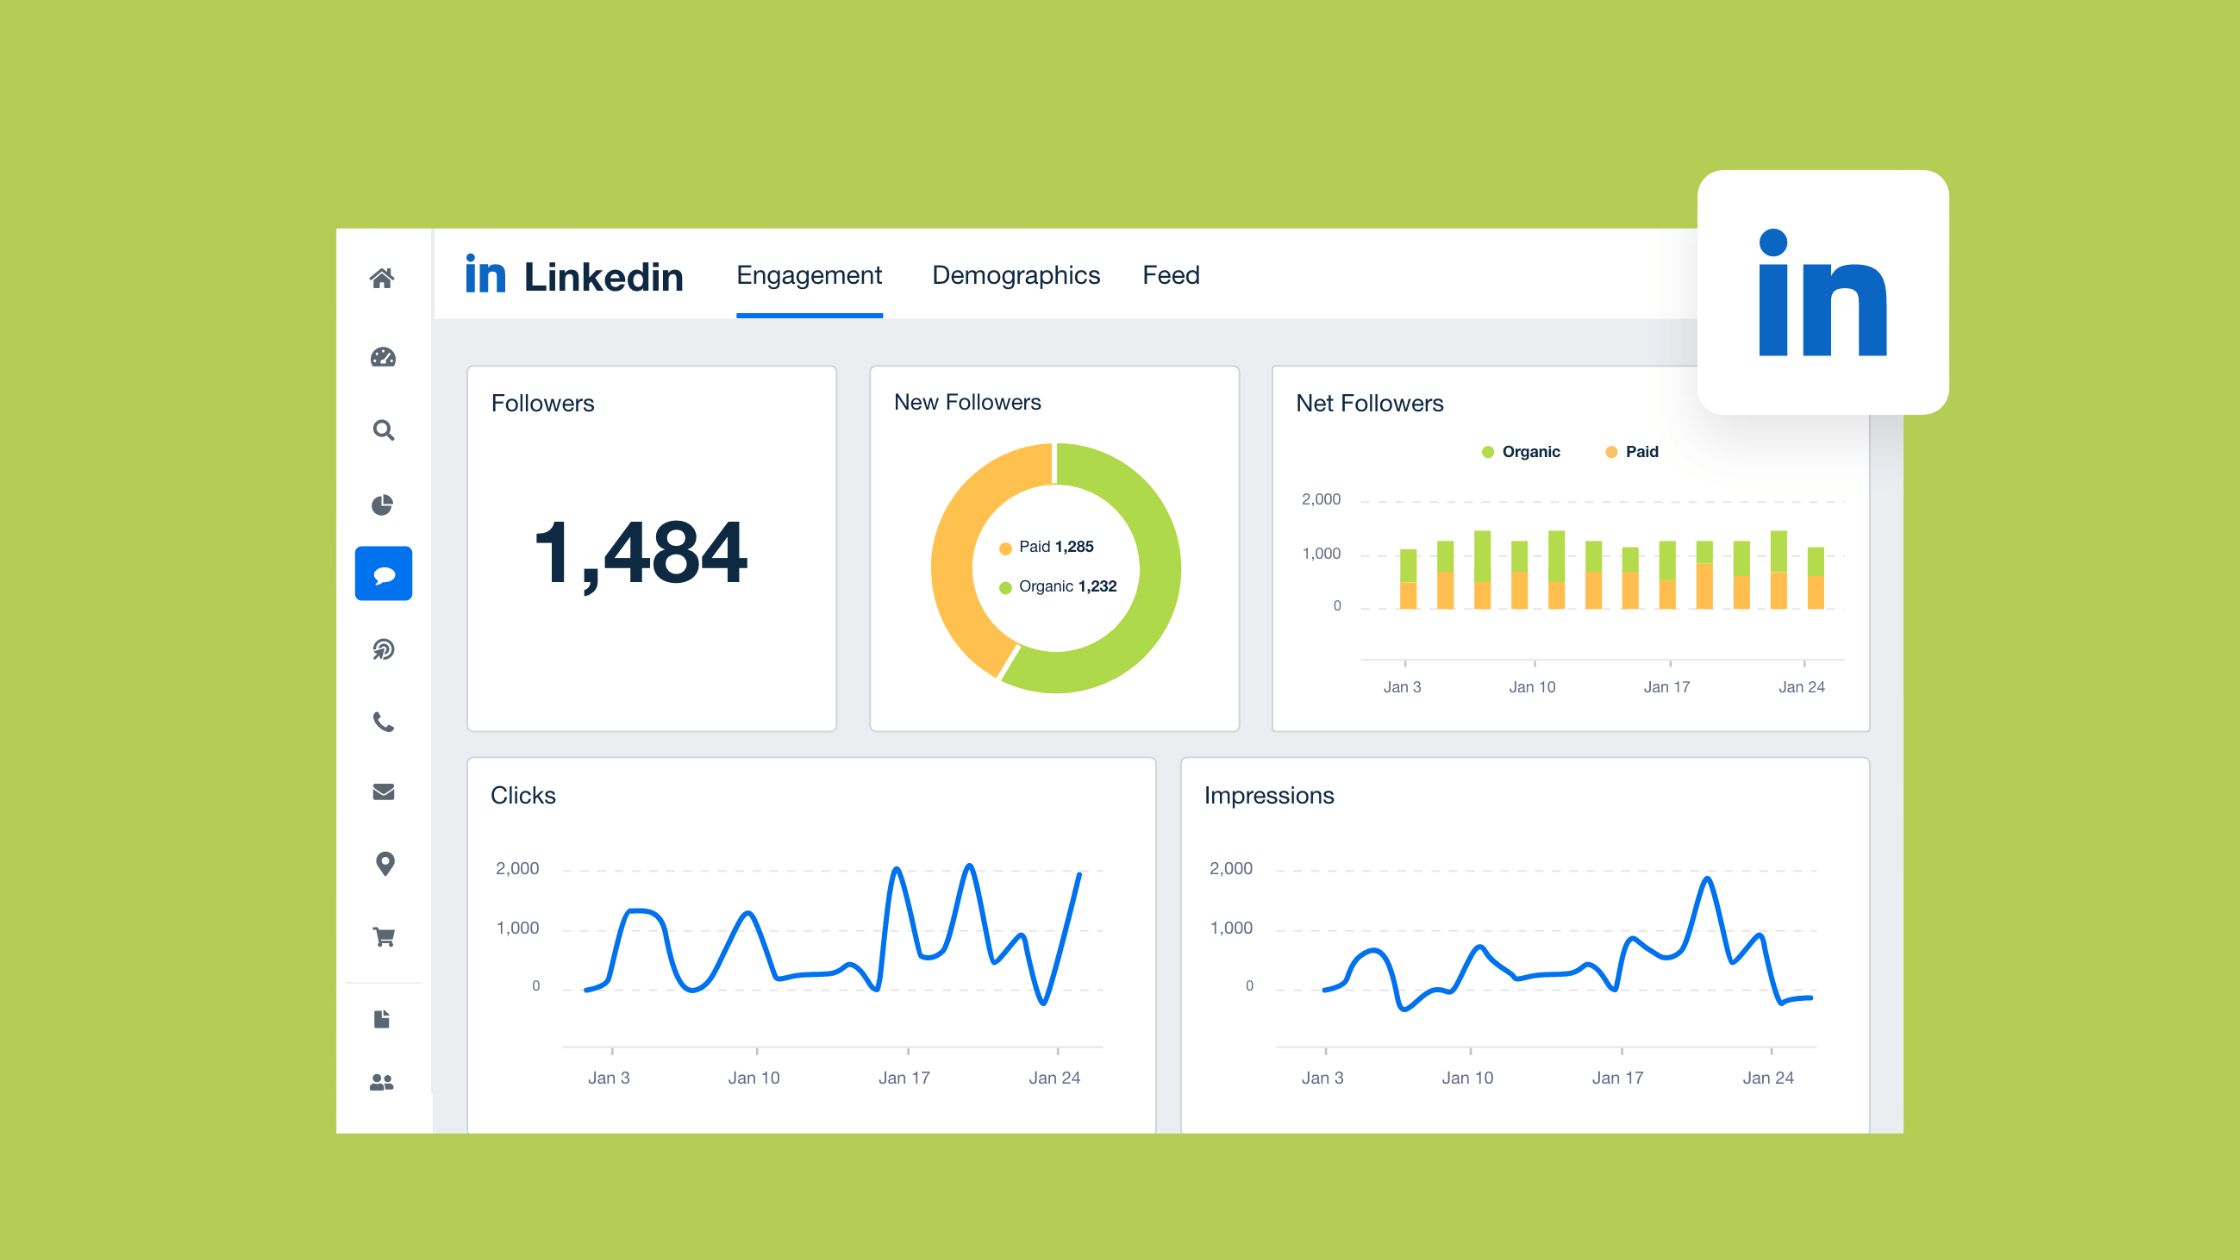
Native analytics refers to the built-in dashboard inside LinkedIn itself — accessible via your profile or page under Analytics. Third-party tools connect via LinkedIn's official API to pull that same data, then add layers of historical comparison, competitor context, export capability, and automated reporting that LinkedIn's own dashboard doesn't offer. Think of native analytics as a rear-view mirror — it shows where you've been. Third-party tools add a GPS: where you are relative to others, and which route is fastest from here.
Now that the core distinction is clear, here's how those third-party tools actually work under the hood.
Most LinkedIn data analytics software connects to your account using OAuth authentication — you grant the tool read access via LinkedIn's official API, and it begins pulling post performance, follower demographics, and engagement data into its own database. No password sharing, no scraping. The API is the authorized bridge.
Once data flows in, tools normalize and aggregate it — combining raw impression counts, click data, and follower change rates into visualizable trends. This is where dashboard design matters enormously: a well-structured tool surfaces "your Tuesday posts outperform Friday posts by 40%" in seconds. A poorly designed one buries that same insight in three clicks of raw exports.
LinkedIn's algorithm distributes content in waves — a small initial push to your first-degree connections, then wider distribution if early engagement velocity is strong. Engagement velocity is the speed at which a post receives likes and comments after publishing — and it's the single most important signal in LinkedIn's distribution model.
What your analytics data actually reflects isn't just how good your content is — it reflects how quickly your network responded to it in the first 60–90 minutes after posting. Slow early engagement caps reach permanently, regardless of content quality.
This means analytics tools that show you time-of-day and day-of-week performance patterns aren't just convenient — they're strategically critical. Posting when your audience is most active compounds early engagement velocity, which directly expands your content reach visibility tracking beyond your immediate network. Knowing the mechanism makes the metrics far more actionable.
Teams that track fewer metrics more consistently see better outcomes than teams that monitor everything and act on nothing. The core KPIs worth tracking for LinkedIn growth are:
Audience growth attribution — understanding which specific posts or campaigns drove new followers — is where most beginners get lost. LinkedIn's native tool doesn't connect these dots directly. Third-party tools do it by correlating follower spikes to content published in the same window.
The most common failure mode is optimizing for impressions while ignoring profile visits and connection requests. High reach with zero downstream action usually signals a content relevance problem: you're reaching people, but not the right ones. Meanwhile, saves and meaningful comments are the metrics most predictive of long-term LinkedIn profile performance metrics improvement — yet they're the ones most users ignore in favor of like counts.
The must-have features that separate genuinely useful LinkedIn insights tools from data dashboards that look impressive but don't drive action:
Advanced features worth paying for, depending on your use case:
The most underrated feature combination in any LinkedIn performance tracking tool is scheduling + analytics in a single platform. When your publishing tool and your measurement tool share the same data model, you eliminate the manual step of cross-referencing post dates with performance spikes. Tools like Taplio and Hootsuite offer this natively. For teams running multiple client accounts, an automated reporting dashboard that sends weekly performance summaries removes a recurring manual task that typically consumes 2–3 hours per week per account manager.
Choosing the best LinkedIn analytics tools comes down to matching features to use case — not chasing the platform with the longest feature list. Here's how the leading tools stack up:
| Tool | Best For | Competitor Tracking | Pricing Tier | Standout Feature |
|---|---|---|---|---|
| Shield App | Personal brand / creators | Limited | $8–$25/mo | Deep personal profile analytics |
| Taplio | AI content + analytics | Yes | $49–$149/mo | AI writing + scheduling + analytics |
| Sprout Social | Enterprise teams | Yes | $249+/mo | Richest LinkedIn-specific reporting |
| Hootsuite | Multi-platform teams | Yes | $99–$249/mo | Cross-platform scheduling + analytics |
| Buffer | Budget-conscious teams | No | Free–$18/mo | Simple scheduling with basic analytics |
| HyperClapper | Creators, founders, agencies | Engagement data | Affordable tiers | Real community engagement + analytics combined |
Shield analytics has become the go-to tool for LinkedIn personal brand builders because it solves the single biggest gap in native analytics: detailed personal profile performance data. Shield LinkedIn analytics tracks post-level performance across your entire history, shows audience growth trends, and surfaces your best-performing content formats — all for a fraction of the cost of enterprise tools. For individuals and solopreneurs focused purely on personal brand growth, Shield remains the benchmark other tools are compared against. For a deeper look at how Shield stacks up against alternatives, see our guide on Shield Analytics competitors for LinkedIn growth.
Free tiers — including LinkedIn's native dashboard, Buffer's free plan, and limited Shield trials — give you enough data to understand your current situation. They rarely give you enough to improve it systematically. The specific things free tools almost universally lack:
Paid tools justify their cost fastest for people posting 3+ times per week who are actively trying to grow — because they have enough data volume to surface meaningful patterns. For someone posting once a month, a free tier is often sufficient.
For agencies managing multiple client LinkedIn accounts, the calculus shifts: per-seat pricing on enterprise tools like Sprout Social becomes expensive quickly. Shield's agency plan and Taplio's team tier are among the most cost-effective options for affordable LinkedIn analytics tools for agencies. HyperClapper's model — which bundles engagement boosting with analytics — can further reduce costs for agencies whose clients need both visibility and measurement without paying for two separate platforms.
With the tool landscape mapped, the real question is which features actually matter for your specific growth goal — especially if you're a B2B marketer where pipeline, not just impressions, is the measure of success.
For LinkedIn analytics tools for B2B marketers, the non-negotiable feature is audience demographics data — specifically job title, seniority level, and industry. Without this, you're flying blind on whether your content is reaching actual decision-makers or just your peers. A pattern consistently observed across B2B LinkedIn campaigns is that high impression counts with low seniority-level engagement signals a targeting or content angle problem, not a volume problem.
LinkedIn marketing analytics for B2B means connecting content performance to pipeline signals. That means:
Startup growth teams often need to prove LinkedIn's value quickly — which means skipping vanity metrics entirely and building a simple ROI model from day one. Map three data points weekly: content posted, profile visits generated, and connection requests or DMs received from target-profile contacts. This lightweight framework takes 15 minutes per week and produces clear signals within 30 days. Personal brand builders follow the same logic: the goal isn't follower count, it's audience growth attribution — understanding which content brings the right people into your orbit.
Get Real Engagement Data Alongside Your LinkedIn Analytics
HyperClapper combines community-driven post boosting with performance analytics — so you can see what's working and act on it immediately.
Explore HyperClapper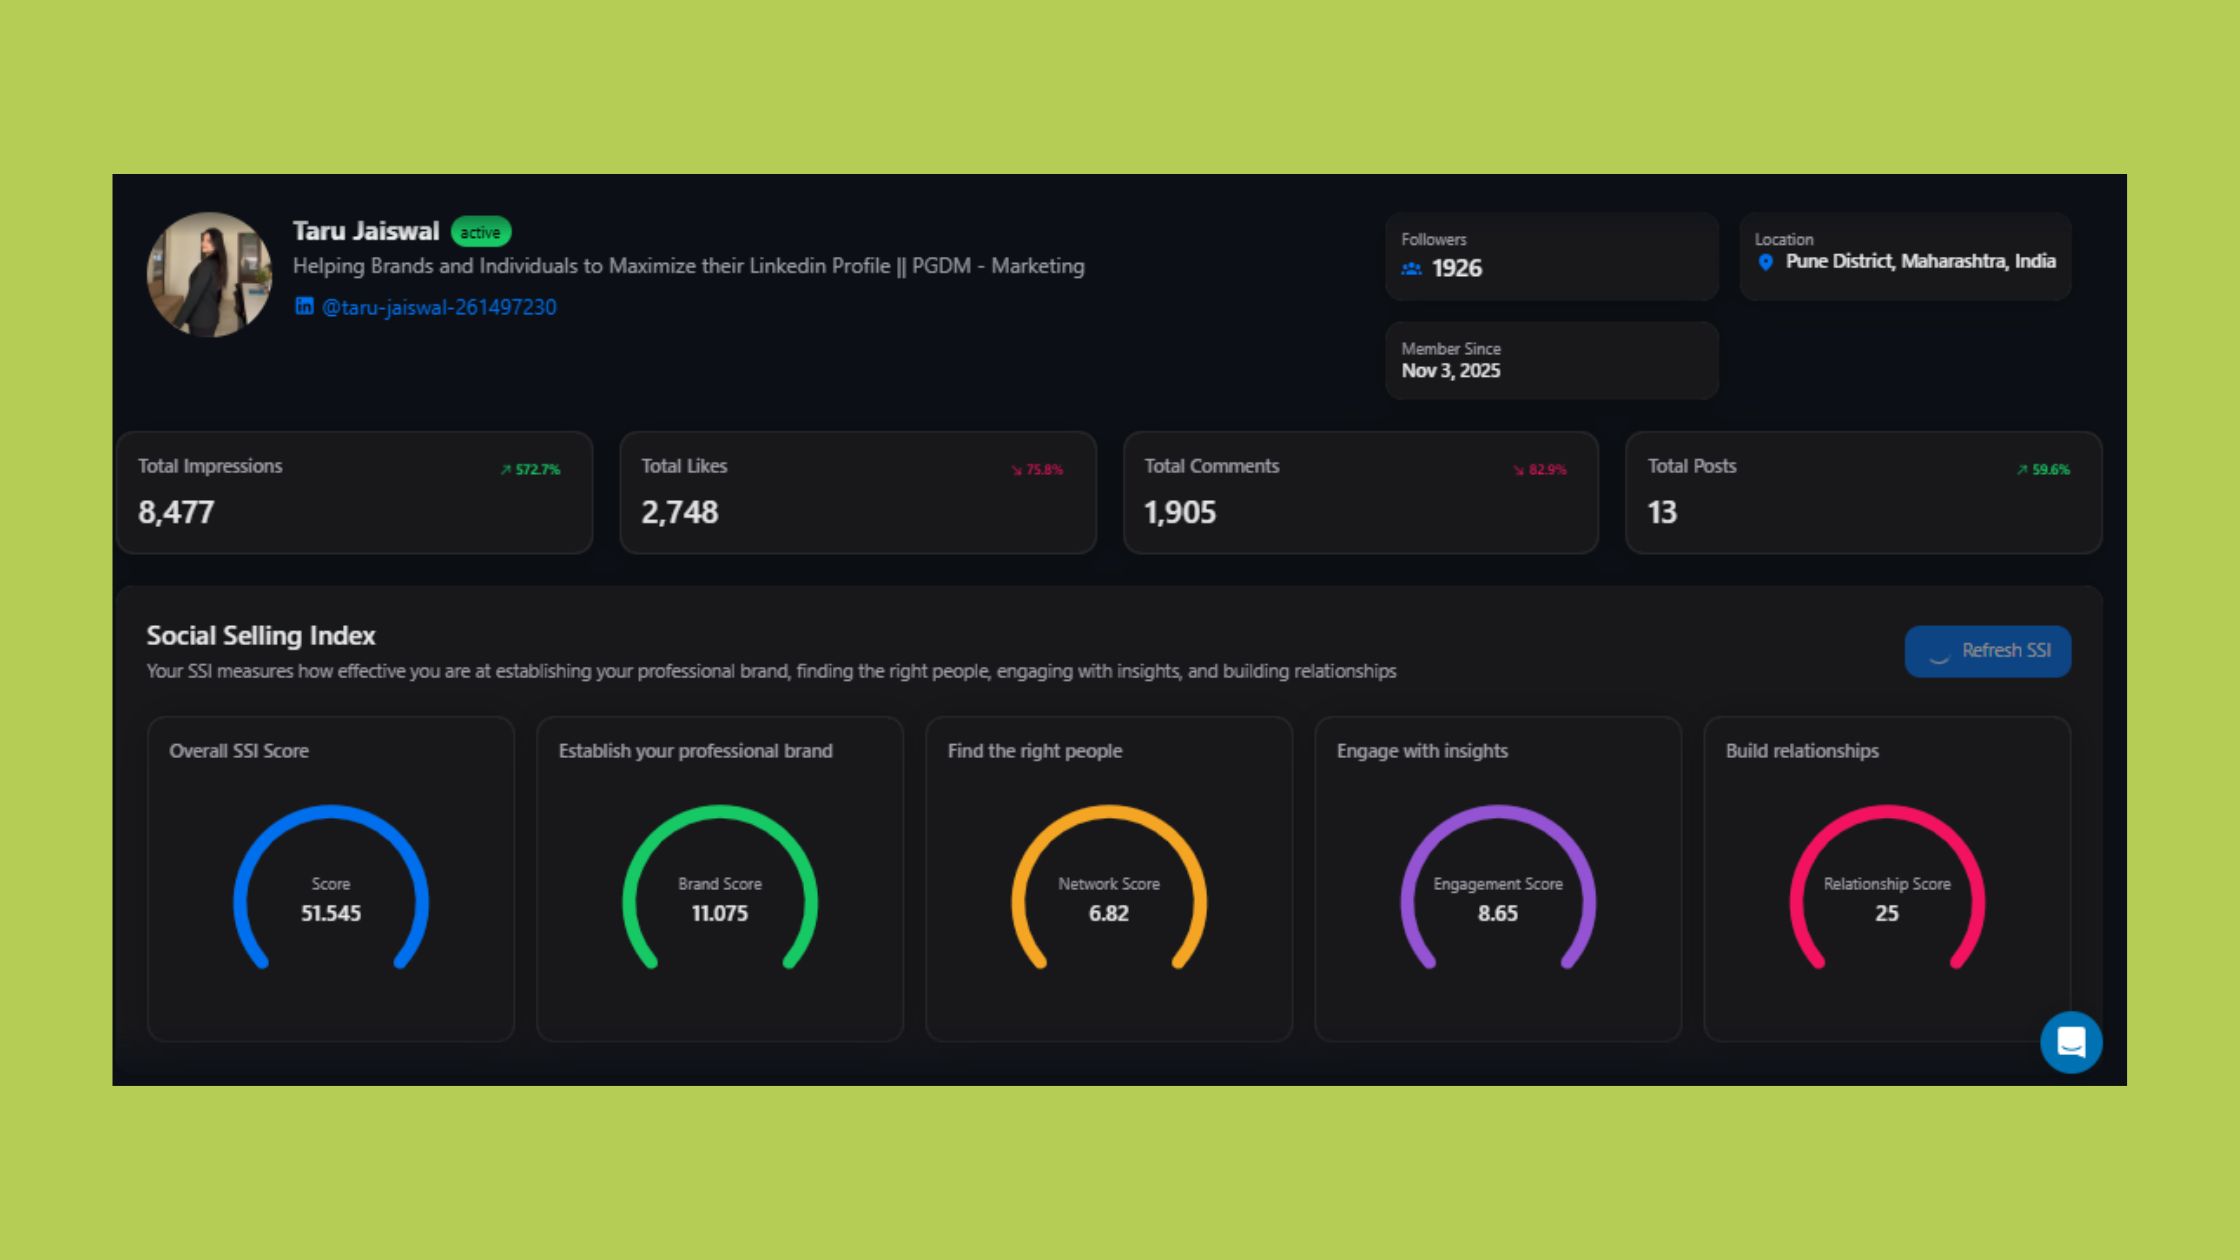
Small businesses rarely need enterprise LinkedIn data analytics software — and the ones that invest in it often don't extract proportional value because the tool is too complex to use consistently. The minimum viable feature set for a small business is simpler than most vendors would have you believe:
The most common failure mode here: a small team subscribes to a $200/month platform, spends two weeks in onboarding, then reverts to checking native LinkedIn analytics because the tool felt overwhelming. LinkedIn analytics tools for small business should prioritize simple dashboards with clear "here's what you should do next" recommendations over comprehensive raw data.
The right approach: start a free trial, set 3 core metrics to track, review them weekly for 30 days, and only upgrade to a paid tier when you can name a specific decision the extra data would improve.
Social media managers need automated reporting above all else — the ability to schedule weekly or monthly performance summaries that go directly to clients or leadership without manual compilation. HR and talent acquisition teams have a different need: follower demographics and content engagement from the candidate audience segments they're trying to attract. A tool that shows "72% of your page followers are mid-level professionals in tech" is far more useful for a recruiter than raw impression counts. Matching the tool's reporting outputs to the specific question your team needs answered weekly is the fastest path to consistent usage — and consistent usage is what actually drives growth. For a broader look at how analytics integrates with scheduling and other tools, the guide on LinkedIn tools for scheduling, carousels, and analytics covers the full stack.
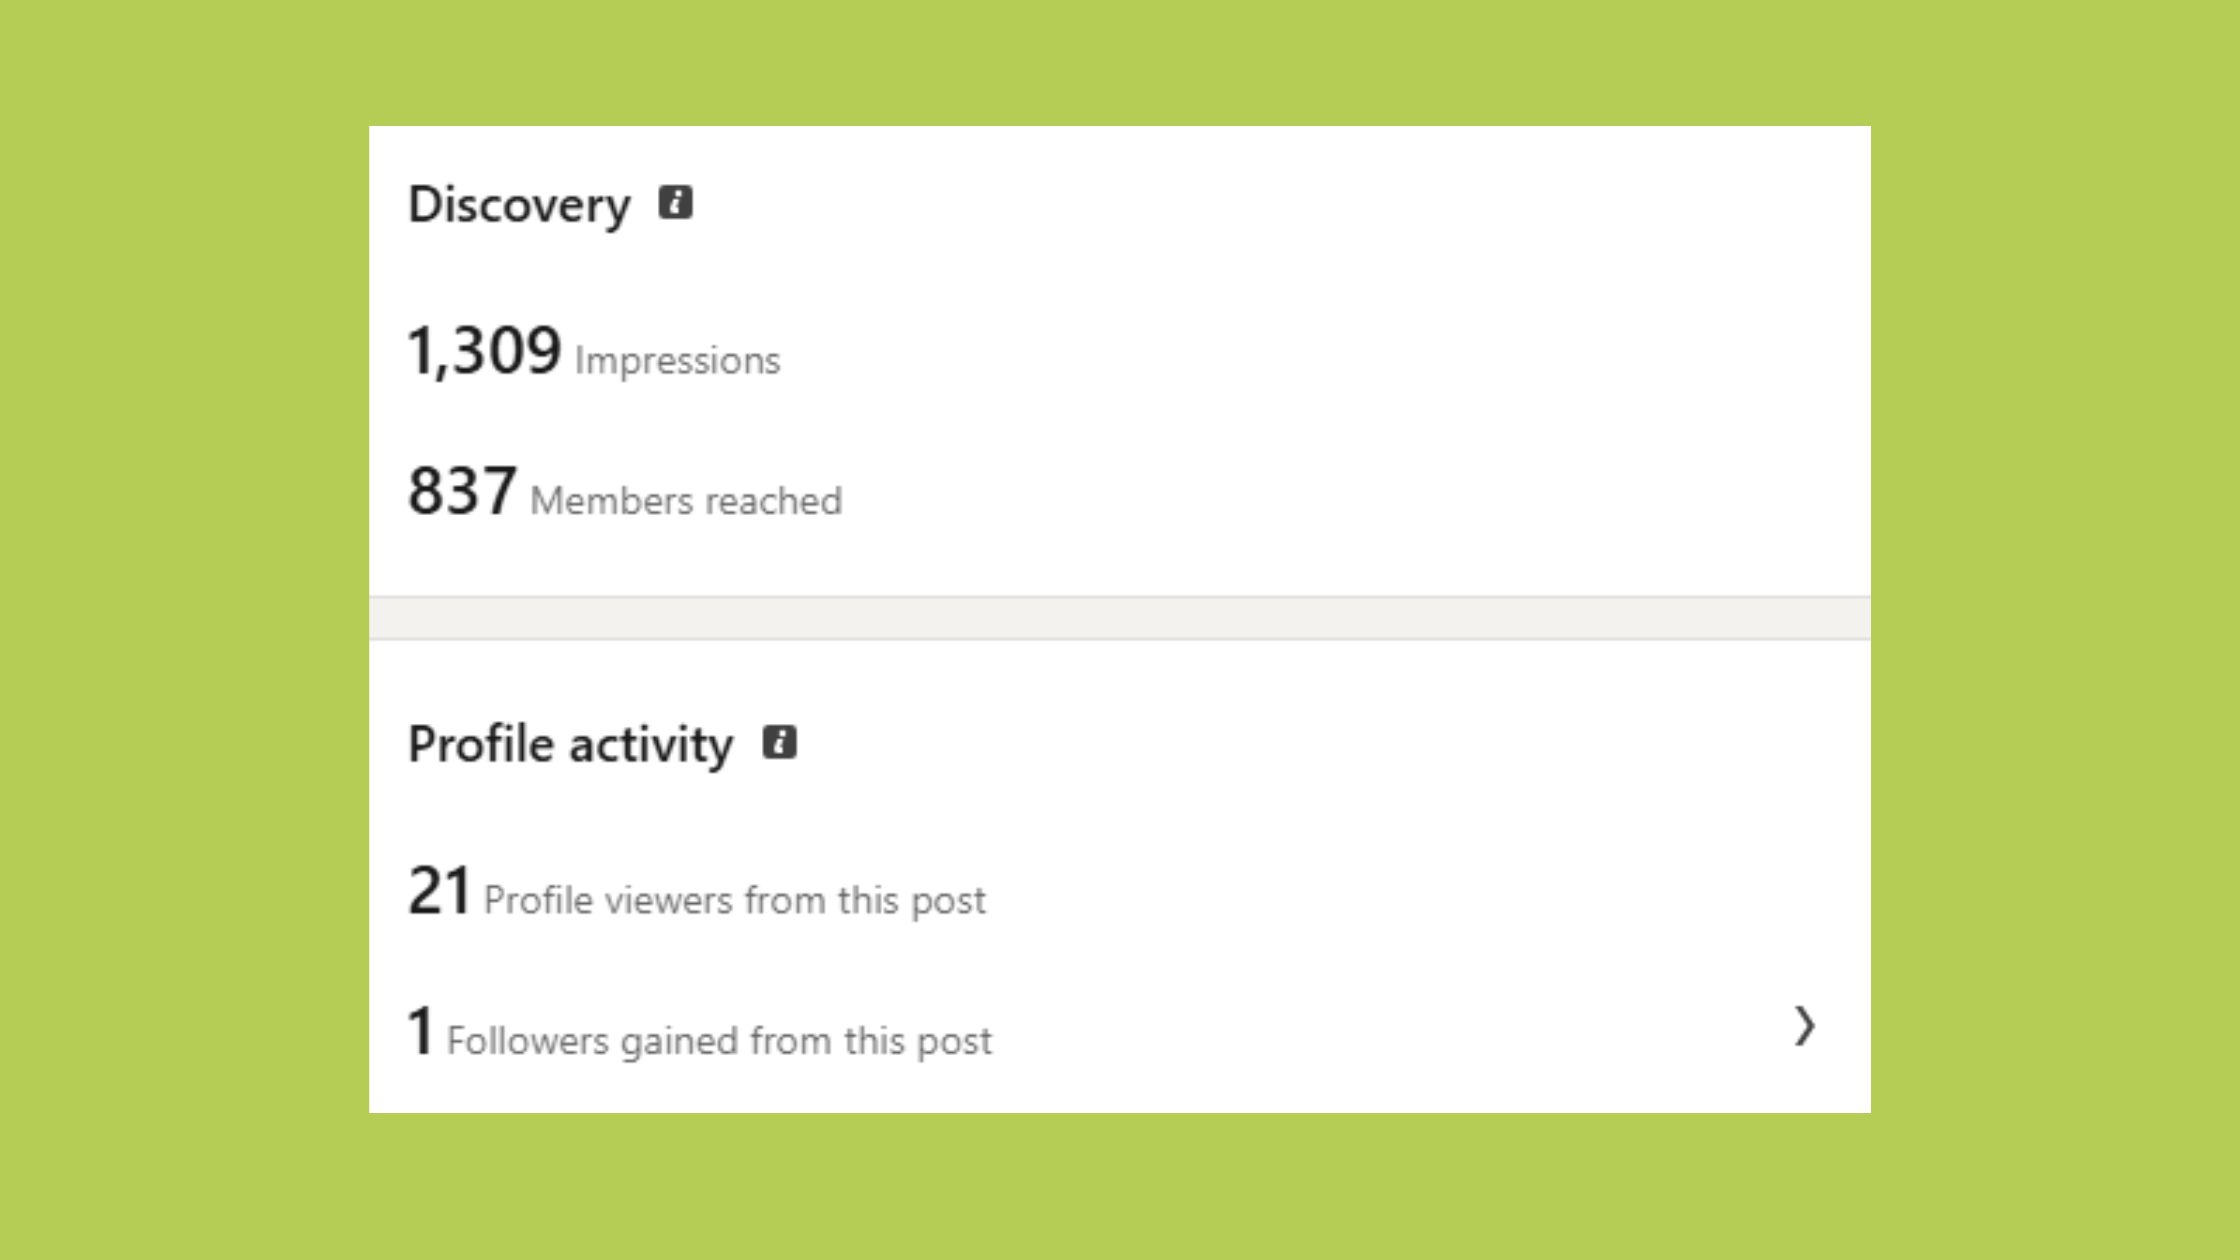
The most widespread frustration among LinkedIn users — particularly personal brand builders — is that native analytics are especially weak for individual profiles. Company pages get richer default data: follower demographics, visitor analytics, and content performance breakdowns. Personal profiles get far less. This asymmetry is the single biggest driver of third-party tool adoption among creators and solopreneurs.
The specific pain points reported most consistently:
For anyone posting more than twice per week with a specific growth goal, third-party LinkedIn analytics tools are worth the investment — because native analytics doesn't give you enough signal to improve systematically. The payoff isn't richer data for its own sake. It's faster feedback loops: knowing within 48 hours which post format is outperforming so you can replicate it next week, not next quarter. For a thorough safety and compliance perspective, the safe LinkedIn analytics tools guide for serious professionals covers what to watch for when connecting third-party tools to your account.
The professionals who plateau on LinkedIn are almost never the ones who lack good content — they're the ones who lack a feedback mechanism that tells them which of their good content is actually working.
Measuring LinkedIn marketing ROI starts with defining what "return" means for your specific goal — because the answer is different for a B2B SaaS founder (pipeline influenced) versus a recruiter (qualified candidate applications) versus a consultant (inbound inquiry volume). Once the outcome metric is defined, the framework is straightforward.
The LinkedIn ROI Tracking Framework works in four steps:
What separates top performers here is the CRM connection step. Without UTM tagging, LinkedIn gets no credit in most attribution models — which makes it easy for leadership to question the channel's value even when it's directly generating pipeline.
LinkedIn analytics tools to improve content strategy create a compounding effect on lead generation: better data reveals which content attracts your ideal audience, which you then create more of, which attracts more of the right people at scale. A recurring pattern among B2B content marketers using data-driven posting is that 20% of their content types generate 80% of their pipeline-relevant clicks. Analytics surfaces that 20% quickly — so the other 80% can be reallocated. For a comprehensive look at how analytics and automation work together in a B2B context, the guide on LinkedIn analytics and automation tools for marketers and sales teams is worth reading alongside this one.
After seeing this across thousands of LinkedIn accounts and campaign setups, the pattern of failure is almost always one of four things:
Most analytics tools tell you what happened to your posts. HyperClapper gives you a way to actively influence what happens — then measure the result. By boosting posts through real community engagement channels, HyperClapper generates early engagement velocity that improves LinkedIn's algorithmic distribution. The built-in analytics then show you how that engagement translates into impressions, profile visits, and follower growth — closing the loop between action and outcome. For teams already using a dedicated analytics platform, HyperClapper functions as the engagement engine that feeds better data into whichever measurement tool you prefer. See how this compares to outreach-focused tools in the Skylead vs HyperClapper comparison.
The right LinkedIn analytics tool isn't the one with the most features — it's the one you'll actually use consistently because it surfaces the exact insight your growth goal requires. Use this four-step framework:
Turn LinkedIn Data Into Real Visibility
HyperClapper gives you real community engagement, AI-powered replies, and analytics — so you can grow faster without guessing what works.
Start Growing on LinkedInOn LinkedIn, analytics is found under the "Me" icon on desktop — go to your profile, then scroll down to find the Analytics section showing post impressions, profile views, and search appearances. For company pages, click "Analytics" in the left navigation of your Page admin view. On mobile, access analytics by tapping your profile photo, then "View Profile," and scrolling to the Analytics panel.
The most useful LinkedIn analytics to track regularly are engagement rate, profile views, follower growth rate, post impressions, and click-through rate. For B2B marketers, audience demographics — specifically job title and seniority of your engagers — is the single most actionable metric. Vanity metrics like raw like counts are the least predictive of real growth outcomes.
Track LinkedIn growth metrics over time by connecting a third-party tool like Shield, Taplio, or HyperClapper — since LinkedIn's native dashboard only retains 365 days of data and offers no long-term trend export. Record weekly snapshots of your 3–5 core KPIs in a simple spreadsheet, and review monthly for patterns. Consistent weekly tracking over 90 days reveals trends that shorter windows miss entirely.
Shield App is widely considered the strongest tool specifically for personal brand analytics — it provides deep individual post history, audience growth trends, and content performance breakdowns that LinkedIn's native dashboard doesn't offer for personal profiles. For users who also want engagement boosting alongside analytics, HyperClapper combines both capabilities in one platform.
Yes — provided you choose a tool matched to your actual feature needs rather than the most feature-rich option available. Small teams typically need post performance tracking, follower growth trends, and basic export capability. Agencies add automated client reporting. Both needs can be met at $8–$50 per month. Enterprise tools at $200+/month are only justified when managing 10+ accounts with complex reporting requirements.
A LinkedIn analytics report is a structured summary of your LinkedIn performance data over a defined period — typically covering impressions, engagement rate, follower growth, top-performing posts, and audience demographics. Third-party tools generate these automatically as PDF or CSV exports, which can be scheduled weekly or monthly for team or client distribution.
LinkedIn native analytics is the built-in dashboard — free, accessible, but limited to 365 days of data, no competitor benchmarking, minimal export options, and weak personal profile data. Third-party LinkedIn analytics tools connect via the official API to provide unlimited history, competitor comparisons, automated reporting, and deeper demographic breakdowns — all for a monthly subscription fee that varies by platform.