The statistics for email marketing tell a clear story: email is not dying — it is quietly dominating while social platforms erode organic reach. A pattern observed consistently across B2B marketing programs is that email delivers measurable, attributable revenue while LinkedIn delivers influence that is real but harder to close. The tension between them is not which one works — both do — but which one you should prioritize, when, and how to read your own numbers correctly instead of comparing them to misleading industry averages. This article gives you the current benchmarks, the conversion comparison, and a diagnostic framework for making that call with confidence.
- Email users statistics now exceed 4.6 billion globally — email reaches more people than any social platform, including LinkedIn's ~1 billion members.
- Email marketing ROI averages $42 for every $1 spent — the highest measurable return of any digital channel.
- LinkedIn organic reach has dropped to 5–8% of your follower count in 2026, making free distribution unreliable without engagement signals.
- Email conversion rates for B2B run 2–5x higher than LinkedIn-driven traffic for direct lead generation funnels.
- The most common mistake: reading a 22% open rate in isolation — without industry baseline, list age, and measurement method, that number means almost nothing.
- The strongest B2B programs use both channels together — LinkedIn for awareness and warm pipeline, email for nurture and close.
- Email Marketing in 2026: The Numbers That Actually Matter
- LinkedIn Organic Reach Statistics: What the Algorithm Is Actually Giving You
- Email vs LinkedIn for B2B Marketing: A Direct Conversion Comparison
- Email Marketing Stats That Separate High Performers from the Average
- How to Diagnose Your Own Email and LinkedIn Metrics
- Best Email Marketing Tools for B2B and LinkedIn Amplification Tools Compared
- Frequently Asked Questions: Email Marketing Statistics vs LinkedIn Reach
Email Marketing in 2026: The Numbers That Actually Matter
According to The Loop Marketing (2026), 392.5 billion emails will be sent per day this year, with global email users statistics reaching 4.6 billion — a user base that dwarfs LinkedIn's roughly one billion members by a factor of four. Scale alone does not make a channel effective, but it does establish email as the default digital communication layer across every industry and job function.
According to Copy.ai's ROI analysis (2025), email marketing carries an average 42:1 return — and Litmus data shows 35% of companies are already achieving $10–$36 per $1 spent, with 18% exceeding $70 per $1 invested. In practice, this means a $5,000/month email program generating $210,000 in attributable pipeline is not exceptional — it is the median expectation for a well-managed list. Revenue per email sent — the metric that ties volume to output — averages $0.08–$0.12 for B2B campaigns, with top-performing segmented sends reaching $0.25+.
Email Marketing Facts: Scale, Reach, and Adoption
The email marketing facts that matter for strategic planning are not the headline ROI figures — they are the adoption rates that tell you how reliably you can reach your audience. According to Forbes Advisor (2025), email users are projected to reach 4.73 billion by 2026. That means roughly 59% of the global population has an email address — and in developed B2B markets, professional email penetration runs even higher. Thirty-three percent of marketers send weekly emails as their primary cadence, a figure that has held steady across multiple years because weekly sending balances list fatigue against algorithmic decay (a problem email does not have, but LinkedIn does).
Industry-Specific Benchmarks: Why Generic Averages Mislead You
The most common failure mode when reading statistics about email marketing is comparing your numbers to an all-industry average. According to Mailchimp's benchmark report, average open rates vary from under 20% in ecommerce to over 40% in government and education. A 22% open rate in retail is strong; the same 22% in a professional services list would signal underperformance. The number only has meaning relative to your vertical, your list age, and how your email service provider (ESP) measures opens — Apple's Mail Privacy Protection has inflated "open" counts since 2021, meaning pre-MPP benchmarks are not directly comparable to 2024–2026 data. CodeCrew's 2026 analysis puts the MPP-adjusted average open rate at 21–25%, versus the unadjusted figure of 30.7% from Omnisend — a 9-point swing that depends entirely on measurement method, not campaign performance.
The single most expensive mistake in email marketing is not a bad subject line — it is benchmarking your performance against the wrong industry average and optimizing for a number that was never relevant to your audience.
Understanding where email stands at scale sets the foundation for the harder question: what is LinkedIn's algorithm actually delivering in return for the same time and budget investment?
LinkedIn Organic Reach Statistics: What the Algorithm Is Actually Giving You
Roughly 5–8% of your LinkedIn followers see any given organic post in 2026 — down from peaks above 15% in 2020–2021. That decline is not an accident; it reflects LinkedIn's deliberate shift toward paid distribution and its algorithm's heavier weighting of early engagement signals. LinkedIn organic reach statistics show a platform that still rewards quality content, but with a shrinking and less predictable free window.
What Is the Average LinkedIn Post Reach in 2026?
The average LinkedIn post reach — defined as the percentage of followers who see an organic post in their feed — sits between 5% and 8% for accounts without strong algorithmic momentum. Posts that generate high dwell time and substantive comments within the first 60–90 minutes can break out of this range, but consistent organic reach above 10% requires either strong early engagement or paid amplification. Teams that invest in early engagement signals consistently see their posts distributed beyond their follower base into first- and second-degree connections — this is the mechanism that makes LinkedIn's reach variable and hard to predict from a single post's metrics.
For a deeper look at how LinkedIn's algorithm distributes organic content and what you can do about it, see this analysis of B2B social media marketing in 2026 — it covers what is working now beyond the standard advice.
Understanding what LinkedIn's algorithm is and is not giving you for free makes the conversion comparison far more honest — and more useful for budget decisions.
Email vs LinkedIn for B2B Marketing: A Direct Conversion Comparison

Email marketing conversion rate statistics from HubSpot (2026) show a 2.4% conversion rate for B2B email, with top-performing segmented campaigns reaching 4–6%. LinkedIn-driven traffic to the same landing pages typically converts at 0.5–1.2% — a gap that reflects intent, not quality. Email subscribers opted in; LinkedIn visitors clicked out of curiosity. That intent gap is why email wins on direct conversion even when LinkedIn drives more total impressions.
| Channel | Best For | Avg. Conversion Rate | Measurable ROI | Reach Reliability |
|---|---|---|---|---|
| Email Marketing | Mid-to-bottom funnel nurture, close | 2.4–6% (B2B) | $42 per $1 spent | High (85–88% deliverability) |
| LinkedIn Organic | Top-of-funnel awareness, warm pipeline | 0.5–1.2% | Difficult to attribute directly | Low (5–8% of followers) |
| LinkedIn Paid | Account-based targeting, retargeting | 1.5–3% (with strong offer) | Trackable but expensive per lead | High (budget-dependent) |
Does Email Marketing Still Work in 2026? Addressing the 'Is It Dead' Myth
The "is email marketing dead" narrative resurfaces every two to three years and has been wrong every time. What the email marketing stats actually show is the opposite: the channel is growing in user base, growing in ROI benchmarks, and increasingly accurate in targeting due to behavioral automation. What has changed is that bad email — generic blasts to cold lists — performs worse than ever, while personalized, segmented email performs better than ever. The channel is not dying. The easy version of it is.
Email vs LinkedIn for B2B Outreach: Use Cases and Audience Fit
The clearest framework for email vs LinkedIn for B2B marketing is funnel position, not channel quality. LinkedIn excels when a prospect does not know you exist — your post introduces your thinking, builds familiarity, and makes the subsequent cold email dramatically warmer. Email excels when a prospect is already in your ecosystem — they signed up, clicked before, or came from an event — and you need to move them to a meeting or purchase. The attribution window discrepancy — the gap between when LinkedIn influence happens and when it shows up in email conversion data — means single-channel attribution routinely understates LinkedIn's contribution to deals that close via email. The practical implication: the channels are not competing; they are sequencing.
Email Marketing Stats That Separate High Performers from the Average
Segmentation is the single highest-leverage variable in email marketing statistics. The difference between a 2.3% click-through rate and a 5%+ rate is almost never the writing — it is whether the email went to the right segment at the right moment. What separates top performers here is not budget or list size but the discipline to define segments based on behavior rather than demographics alone.
Best Send Times, Mobile Optimization, and Personalization: The Stats
The email marketing facts on personalization are unambiguous: personalized subject lines lift open rates by roughly 26%, and behavior-triggered emails — sent based on what a subscriber actually did, not a calendar schedule — generate approximately 3x the revenue per email sent compared to broadcast campaigns. These are not edge-case improvements; they represent a structural performance gap between list-blast programs and behavioral programs.
- Mobile email opens: Over 61% of all email opens happen on mobile — emails not optimized for mobile lose roughly 15–20% of potential clicks before content is even read.
- Best send days: Tuesday and Thursday consistently produce the highest open rates across B2B industries; Friday afternoons and Monday mornings are the two lowest-performing windows across most verticals.
- Welcome sequences: Average 50–60% open rates — the highest engagement window in any subscriber's lifecycle, consistently wasted by marketers who treat it as a single confirmation email rather than a three-to-five message orientation sequence.
- Abandoned cart emails: According to Robly's 2026 data, abandoned cart emails achieve open rates above 50% and conversion rates of 8–10% — making them the highest-ROI automated sequence available to ecommerce and SaaS teams with a trial-to-paid funnel.
- Email automation benchmarks: Automated sequences consistently outperform manually scheduled sends by 2–4x on conversion — not because the content is better, but because the timing is triggered by behavior rather than a marketer's calendar.
The email marketing roi statistics on automation are particularly stark. Creators who skip behavioral triggers and rely on broadcast cadences typically find their list performance plateauing even as their subscriber count grows — a sign that reach is increasing while relevance is declining.
Want Your LinkedIn Content to Work Harder Before It Hits the Inbox?
HyperClapper boosts your LinkedIn posts with real engagement from genuine users — so your content builds the warm audiences that convert better in email.
See How HyperClapper WorksHow to Diagnose Your Own Email and LinkedIn Metrics (Not Just Read Averages)
A recurring pattern among marketers trying to benchmark their campaigns is using industry averages as a primary diagnostic tool — which is roughly as useful as comparing your resting heart rate to a global average without knowing your age, fitness level, or measurement method. The number is real; the comparison is meaningless without context.
Common Mistakes Marketers Make When Reading Email and LinkedIn Data
The core conflict most marketers encounter is reconciling what their ESP (email service provider) reports versus what Google Analytics shows. These tools are measuring different things. Your ESP measures email-side events: opens (often inflated by MPP), clicks from the email client, and unsubscribes. Google Analytics measures site-side behavior: sessions, goal completions, and revenue attributed to the email source. Both are correct — they are just answering different questions. Trusting your ESP's click count as a conversion metric is like trusting a door counter to measure how many people bought something inside the store.
- Open rate without MPP context: Since Apple's Mail Privacy Protection prefetches emails, open rates in Apple Mail are recorded even if the user never opened the email. If your list is heavily Apple Mail users, your open rate is structurally inflated — compare click rate and reply rate instead.
- Unique opens vs total opens: These can differ by 20–40% on the same campaign. Always benchmark using unique opens; total opens inflate the appearance of performance.
- LinkedIn impressions as reach: Impressions count every time a post appears in a feed — including partial views while scrolling. Engagement rate (interactions ÷ impressions) and click-through rate are the metrics that indicate whether content actually connected.
Cohort-based performance analysis — comparing your current 90-day period against your previous 90-day period — is more actionable than any industry benchmark. Your own trend line tells you whether a change you made actually worked. An industry average tells you nothing about what moved.
Sender reputation score is the silent variable most marketers never check. Tools like Google Postmaster, MXToolbox, and Validity's Everest let you monitor the deliverability signals your subscribers never report. A degraded sender reputation — caused by high bounce rates, spam complaints above 0.1%, or sudden volume spikes — can cut your email deliverability rate from 88% to 60% without any visible warning in your ESP dashboard. When your open rates drop suddenly without a content change, check your sender health before redesigning your subject lines.
Best Email Marketing Tools for B2B and LinkedIn Amplification Tools Compared
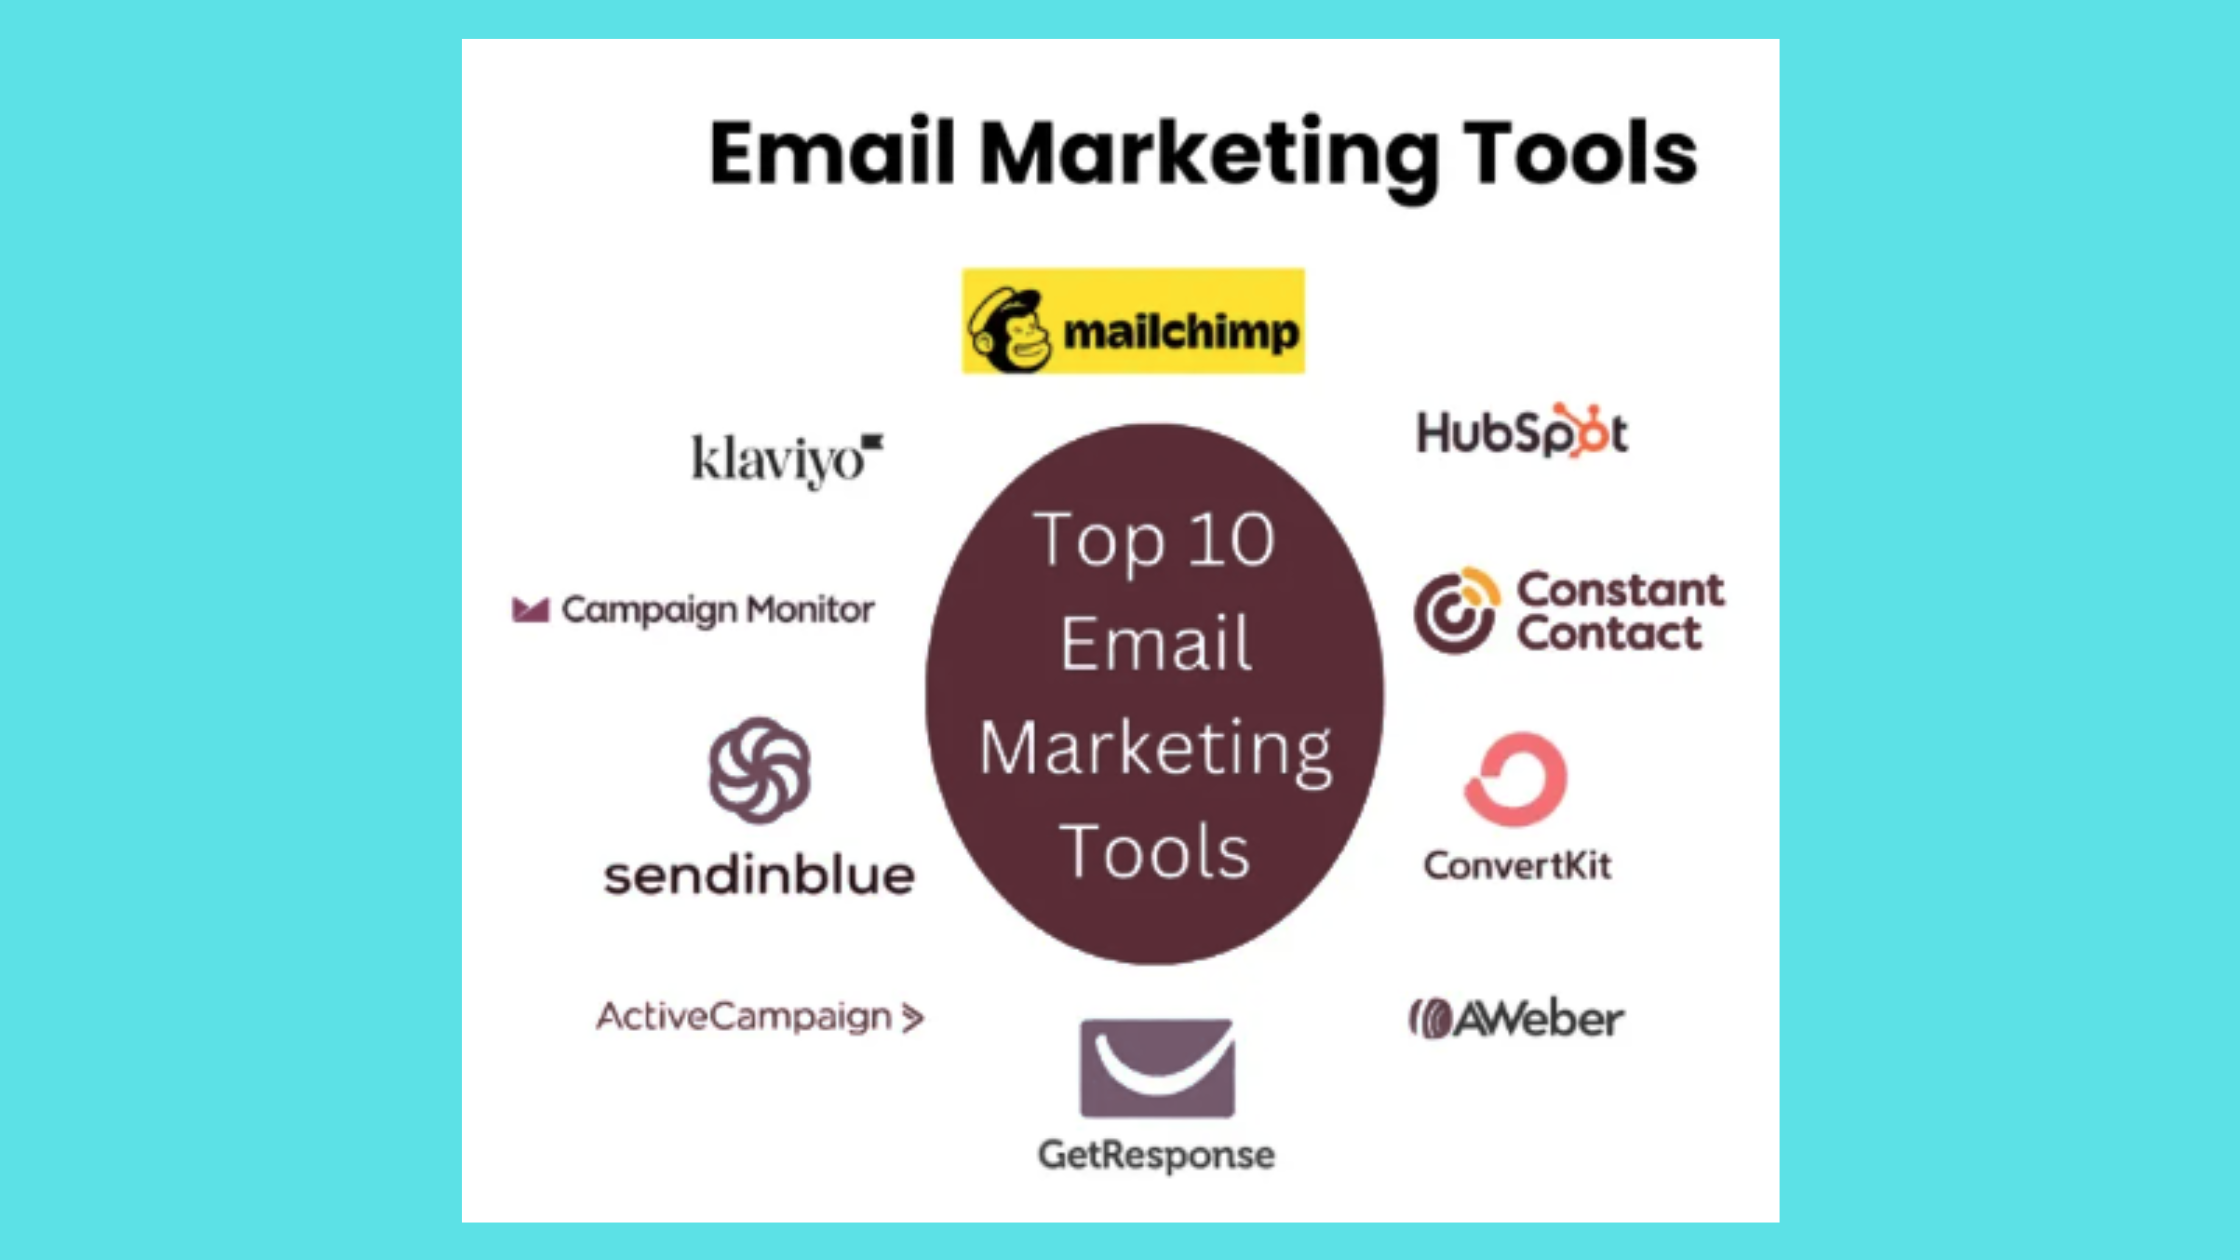
The best email marketing tools for B2B in 2026 split clearly by use case rather than by size or price tier. The right tool depends on where your CRM integration sits and how complex your nurture sequences are.
- HubSpot & ActiveCampaign: Best for teams that want CRM-integrated nurture — lead scoring, deal-stage triggers, and full attribution built in. Heavier setup cost, higher ongoing value for teams running multi-touch sequences.
- Mailchimp & Brevo: Best for SMB simplicity — fast setup, reliable deliverability, lower learning curve. Limited on behavioral automation depth.
- Klaviyo: Best for ecommerce-heavy B2B — deep Shopify/WooCommerce integration, revenue-per-email reporting out of the box.
LinkedIn Sales Navigator vs Email Outreach
LinkedIn Sales Navigator vs email outreach tools is a comparison that often gets framed as a choice — it is not. LinkedIn Sales Navigator is a prospecting database: it helps you identify and segment the right people. Email sequencers like Apollo, Lemlist, and Outreach are delivery engines: they send your message at scale and track responses. They solve different parts of the same problem. The highest-performing outbound programs use Navigator to build precise lists, then use email sequencers to reach those contacts — with LinkedIn connection requests sent in parallel to warm the relationship before the email arrives.
For a detailed breakdown of Navigator's lead generation mechanics, see this guide on LinkedIn Sales Navigator lead generation.
How HyperClapper Fits Into a LinkedIn + Email Strategy
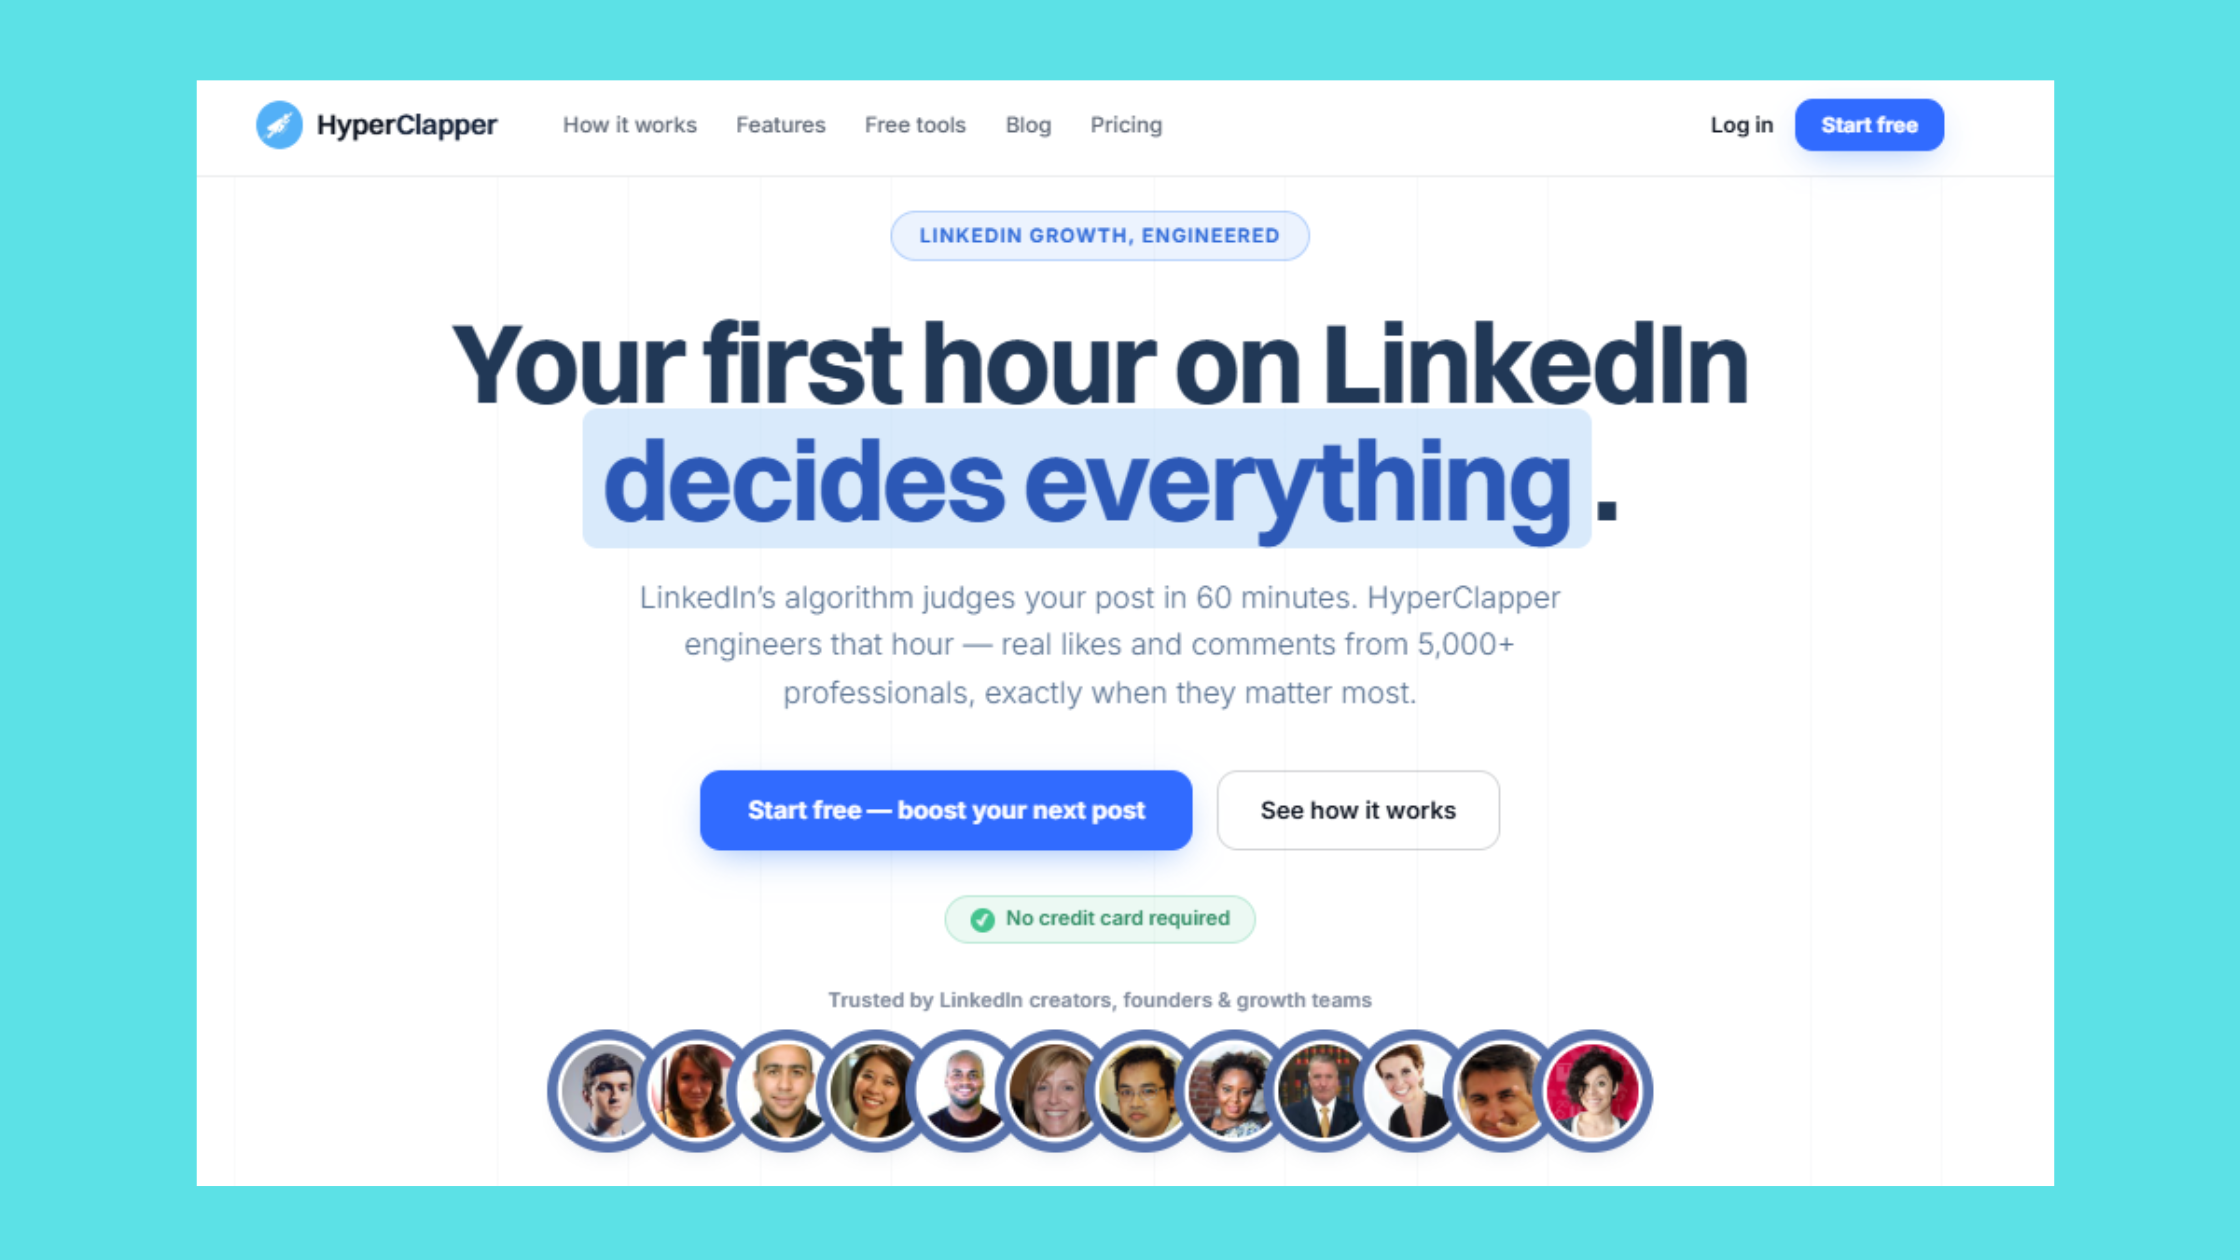
For teams running a combined LinkedIn-and-email program, the weakest link is almost always LinkedIn organic reach — specifically, the inability to get early engagement signals on posts that would otherwise be suppressed by the algorithm. Tools like HyperClapper address this by connecting posts with real users through channel-based engagement groups, generating genuine likes, comments, and AI-powered replies that signal conversation depth to LinkedIn's distribution model. The practical effect: posts that would reach 5% of followers with no early engagement can reach 15–25% when they accumulate meaningful interaction within the first hour — without paid promotion.
This is meaningfully different from link-exchange pods or bot engagement. HyperClapper's Content Guard moderation system screens posts for sensitive content, and its engagement comes from real platform users rather than automated accounts — which matters because LinkedIn's spam detection has become significantly more sophisticated at identifying inauthentic signals. For a head-to-head look at how this compares to alternatives, the LinkBoost review for 2026 covers the key differences in detail.
Organic LinkedIn reach without early engagement is a self-fulfilling prophecy: posts that get seen by few generate little engagement, which ensures they get seen by fewer. Breaking this loop requires either paid amplification or genuine early interaction — and the latter is both cheaper and more durable.
✓ The Channel Alignment Checklist: Email + LinkedIn Working Together
- ☐Define your funnel stage for each channel: LinkedIn for awareness/warm pipeline, email for nurture and close
- ☐Set up UTM tracking on all LinkedIn-to-website links to capture LinkedIn-influenced email conversions in GA4
- ☐Monitor sender reputation score monthly via Google Postmaster or MXToolbox — not just ESP-reported metrics
- ☐Segment email list by LinkedIn engagement: subscribers who interacted with your LinkedIn content are your warmest nurture cohort
- ☐Publish LinkedIn posts within the first 60 minutes of your audience's active window and ensure early engagement is present
- ☐Run a quarterly cohort comparison: LinkedIn-warmed prospects vs cold email list — measure open, click, and conversion rate differences
- ☐Audit email sequences for mobile optimization: test rendering on iOS and Android before any major send
Extend Your LinkedIn Post Reach — Without Paid Ads
HyperClapper connects your posts with real engagement groups, generating the early interaction signals that LinkedIn's algorithm uses to decide who sees your content.
Start Boosting LinkedIn PostsFrequently Asked Questions About Email Marketing Statistics vs LinkedIn Reach
Which converts better for B2B leads — email marketing or LinkedIn outreach?
Email marketing converts B2B leads at 2–3x the rate of LinkedIn-driven traffic for direct lead generation funnels, primarily because email subscribers have already opted in. LinkedIn outperforms email for top-of-funnel awareness and relationship warming — making the two channels most effective when used in sequence rather than as direct competitors.
What are the latest email marketing and LinkedIn reach statistics for B2B in 2026?
Current email marketing statistics for B2B show average open rates of 21–25% (MPP-adjusted), CTRs of 2.3–2.9%, and ROI of $42 per $1 spent. LinkedIn organic reach now averages 5–8% of follower count per post. Segmented email campaigns and LinkedIn posts with strong early engagement both outperform their respective channel averages by 2–3x.
Should I focus my B2B marketing budget on email or LinkedIn in 2026?
For measurable, attributable ROI, email wins — it delivers $42 per $1 spent and higher direct conversion rates. For brand visibility, inbound discovery, and warming cold prospects, LinkedIn is worth consistent investment. The strongest B2B programs allocate roughly 60–70% of content effort to email nurture and 30–40% to LinkedIn presence, using LinkedIn to fill the email pipeline rather than replace it.
How does the LinkedIn algorithm limit organic reach compared to email deliverability?
LinkedIn's algorithm makes a distribution decision within the first 60–90 minutes of a post going live, based on early engagement signals. Posts without early likes and comments are suppressed to 5% of followers or fewer. Email deliverability operates differently — an 85–88% email deliverability rate means most messages reach the inbox regardless of engagement, making email reach structurally more reliable than LinkedIn organic reach. For more on extending LinkedIn reach organically, see LinkedIn Chrome extensions for lead generation and outreach.
What is a good email open rate, and how do I know if mine is normal?
A good open rate depends entirely on your industry, list age, and measurement method. According to Mailchimp benchmarks, B2B averages range from 20% to 40%+ by sector. Rather than comparing to a global average, compare your current 90-day cohort to your previous 90-day cohort — your own trend line is a more actionable diagnostic than any published benchmark. Also check whether your ESP accounts for MPP inflation before drawing conclusions.
Is LinkedIn worth it for B2B outreach, and how do I measure its effectiveness?
Yes — but is LinkedIn worth it for B2B outreach depends on how you measure it. Follower count and impressions are unreliable proxies. The metrics that indicate real business value are connection-to-meeting conversion rate, content-attributed lead volume, and pipeline influenced by LinkedIn touchpoints. When tracked properly, LinkedIn's contribution to warm deals is consistently undervalued in single-channel attribution models.
Is LinkedIn Sales Navigator worth it compared to email outreach tools?
LinkedIn Sales Navigator and email outreach tools are not substitutes — Navigator is a prospecting database for identifying and segmenting the right contacts; email sequencers like Apollo and Outreach are delivery engines for reaching them at scale. The highest-performing outbound programs use both: Navigator to build precise lists, email to reach contacts efficiently, and LinkedIn connection requests to warm relationships in parallel. See also: how to convert Sales Navigator links to LinkedIn in bulk.
After seeing this pattern across hundreds of B2B marketing programs, the consistent finding is that teams treating email and LinkedIn as competing for the same budget almost always underperform teams that treat them as a sequence — LinkedIn warming the prospect, email closing the loop. The channel with "better ROI" is always the one used at the right stage for the right intent.