.png)

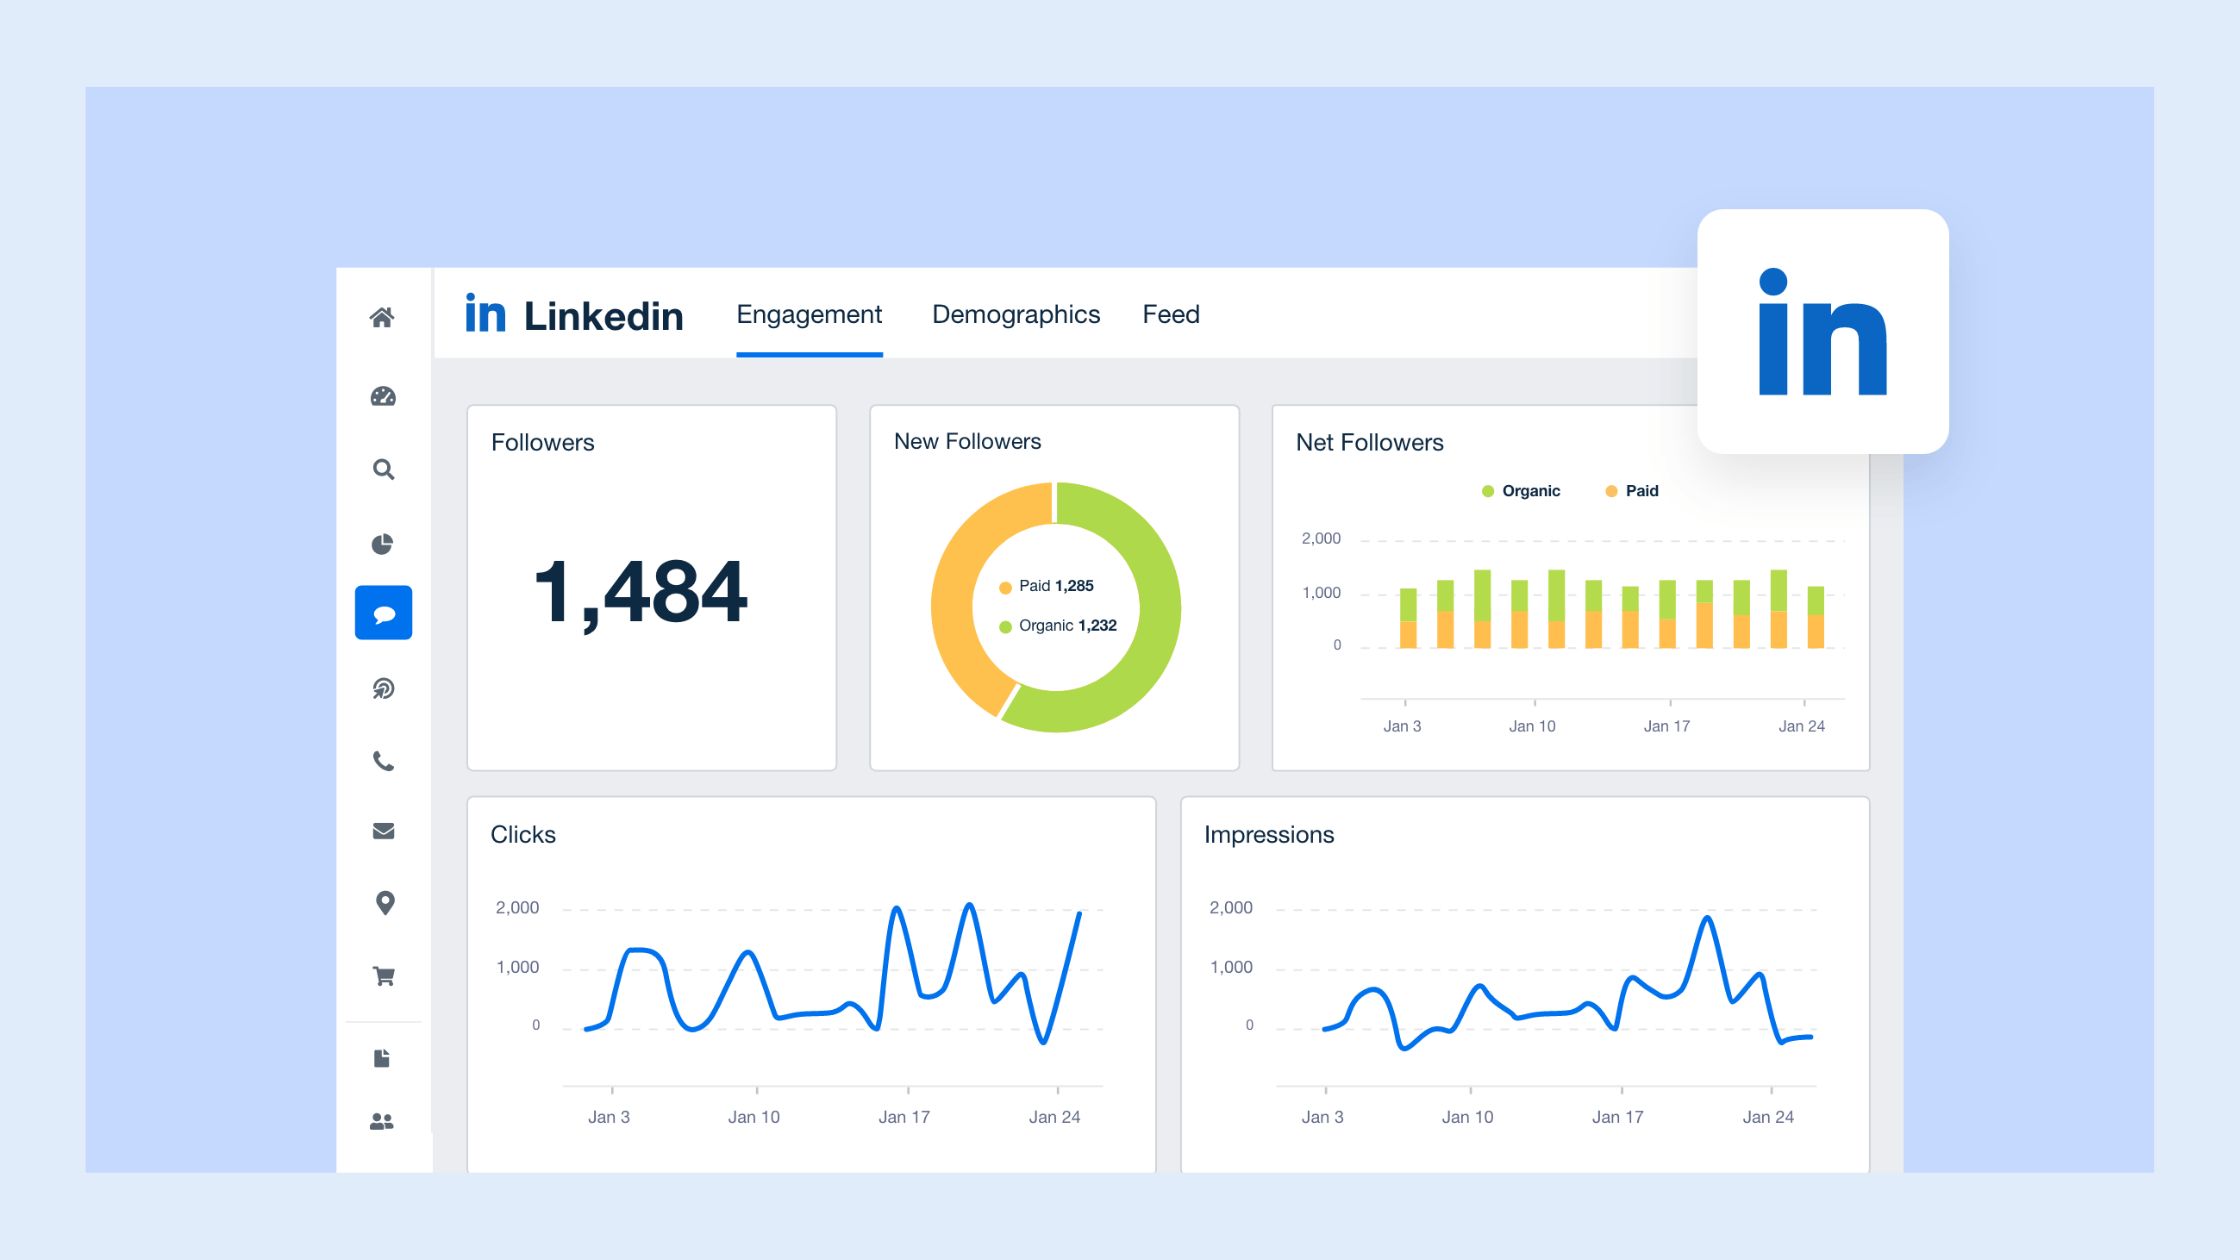
A pattern observed across hundreds of LinkedIn accounts is that slow growth rarely comes from bad content — it comes from bad data. The best LinkedIn analytics tools give you what LinkedIn's native dashboard withholds: post-level history beyond a year, real engagement rate benchmarks, audience demographic insights by seniority and function, and the longitudinal trends that reveal whether your personal branding ROI is actually moving. Most professionals don't know these tools exist. The ones who do tend not to shout about them.
LinkedIn's built-in dashboard is designed for casual review, not serious strategy. It caps post-level historical data, buries demographic breakdowns behind aggregate numbers, and offers zero competitor benchmarking. For anyone trying to run a data-led content strategy, the LinkedIn native analytics dashboard is too limited to be the sole source of truth.
The specific gaps that consistently surface across professional communities:
This gap explains a recurring pattern among LinkedIn creators trying to grow: they're optimizing based on incomplete signals, which is why even people using "all the right strategies" plateau. Third-party LinkedIn analytics software fills these blind spots by pulling from the LinkedIn API, enriching native data, and surfacing content performance attribution signals the native dashboard never exposes.
Understanding why native falls short sets the stage for choosing tools that genuinely solve those specific problems — not just adding more dashboards.
Third-party LinkedIn analytics tools connect via LinkedIn's official API or OAuth authentication — meaning they can only access data you explicitly authorize. This boundary matters: no legitimate tool can pull private data from accounts that haven't authorized access.
Before choosing a tool, understanding the core metrics removes a lot of confusion:
The difference between LinkedIn native and third-party analytics isn't just feature depth — it's the difference between a snapshot and a story. Native shows you today; third-party tools build the longitudinal dataset that tells you whether you're actually trending in the right direction.
Creator-focused tools like Shield and Taplio build this longitudinal layer on top of native data. Agency platforms like Sprout Social and Hootsuite extend it further with multi-account LinkedIn analytics dashboards, automated reporting for clients, and team collaboration features. The mechanism is the same — the use case determines the right fit.
Now that the mechanics are clear, here's how the actual tools stack up against each other.

The tools professionals quietly rely on span four categories: personal brand analytics, all-in-one creator platforms, agency and enterprise dashboards, and niche tracking tools. Each serves a distinct intent.
| Tool | Best For | Standout Feature | Pricing Tier |
|---|---|---|---|
| Shield | Personal brand builders, solo creators | Deep post-level historical data, engagement benchmarking | Paid (from ~$8/mo) |
| Taplio | Creators wanting analytics + AI writing + scheduling | All-in-one: LinkedIn analytics + content suggestions | Paid (from ~$49/mo) |
| Keyhole | Agencies, LinkedIn audience insights tools for teams | Competitor public benchmarking, historical data export | Paid (agency plans) |
| Sprout Social | Agencies, enterprise LinkedIn analytics solutions | Multi-client dashboards, PDF reporting, data depth | Premium (~$249+/mo) |
| Hootsuite | Social media managers, multi-platform teams | LinkedIn post scheduling and analytics combined, price flexibility | Mid-range (~$99+/mo) |
Shield vs. LinkedIn native analytics is the clearest comparison for individual creators: Shield builds the post-history archive that LinkedIn deletes after a year, adds visual engagement rate trend lines, and calculates your personal benchmarks automatically. Taplio vs. Shield comes down to whether you want pure analytics depth or an all-in-one platform — Shield wins on data granularity, Taplio wins on workflow integration.
For a deeper look at how these tools fit into a broader automation strategy, see this guide on LinkedIn analytics and automation tools for marketers and sales teams.
Teams that already use HubSpot, Salesforce, or Buffer often overlook that these platforms include LinkedIn analytics API integration — tracking link clicks from LinkedIn posts directly into CRM pipelines. This is the closest available proxy for LinkedIn lead generation analytics tracking without adding a dedicated tool.
What separates top performers here is not using the most expensive tool — it's using the right tool for their specific job. The metrics a startup founder needs look nothing like what an agency reporting to five clients requires.
For teams evaluating the full toolkit — scheduling, carousels, and analytics in one place — this overview of LinkedIn tools covering scheduling, carousels, and analytics covers the landscape efficiently.
Most professionals who struggle to improve LinkedIn performance are skipping the baseline measurement step entirely. Here's the setup that actually works:

Based on patterns across high-performing LinkedIn accounts, the weekly tracking list is shorter than most people expect:
The most common failure mode is treating tool output as ground truth without accounting for LinkedIn API data delays, sampling limitations, and what the API legally cannot provide. Understanding these constraints prevents expensive mistakes.
Across the paid tools, the value split is roughly:
The vanity metric trap is the most expensive mistake on LinkedIn — accounts optimizing for impressions over engagement rate consistently see high reach numbers alongside zero pipeline impact. Impressions measure distribution. Engagement rate measures resonance. Only one of those predicts business outcomes.
Tool overload is real. Most professionals need one specialized LinkedIn analytics software tool plus one scheduler — not five overlapping subscriptions generating conflicting numbers. For a safety-focused evaluation of which tools operate within LinkedIn's guidelines, this guide to safe LinkedIn analytics tools for professionals is the clearest reference available.
For comparison across the broader landscape of engagement tools — not just analytics — the top LinkedIn engagement tools breakdown covers the distinctions in detail.
Yes — third-party tools surface post-level historical data beyond LinkedIn's 365-day cap, granular audience demographic breakdowns by seniority and function, engagement rate trend lines over time, and content type performance comparisons. These are derived from authorized LinkedIn API data that native simply doesn't display in usable form.
Shield builds a permanent post-history archive that LinkedIn deletes after a year, calculates true engagement rate benchmarks per post, and displays visual trend lines for follower growth. LinkedIn's native dashboard shows recent snapshots only. For personal brand builders tracking progress over months, Shield provides data LinkedIn cannot.
Free native analytics are worth using as a starting point for basic awareness. Paid tools become worth it when you need historical data exports, engagement benchmarking, audience demographic insights, or automated client reporting. Shield, Taplio, and Keyhole consistently earn their subscriptions for professionals who post more than twice per week.
Sprout Social and Keyhole both support automated LinkedIn reporting with scheduled PDF exports and white-label dashboards. Connect client LinkedIn pages via OAuth, configure report templates once, and schedule delivery weekly or monthly. This removes manual export work and gives clients consistent visibility without analyst time per report.
Prioritize engagement rate per post over impressions, follower net gain week-over-week, content type performance by format, and profile visit rate from post viewers. Profile visits are the strongest leading indicator of inbound interest — a metric most creators ignore in favour of likes and impressions that don't predict pipeline.
Only partially. Tools like Keyhole can benchmark public engagement rates on publicly visible competitor posts — likes, comments, and shares that are visible to anyone. No tool can legally access private competitor post analytics, follower demographics, or impression data. Be skeptical of any platform claiming otherwise; it's either misleading or operating outside LinkedIn's API terms.
For B2B content marketers, Taplio or Shield handle personal analytics; Sprout Social handles page-level and team reporting. The right choice depends on whether your priority is personal brand data or company page performance. Most B2B marketers benefit most from tools that show audience demographic breakdown by job title and content performance attribution by format.
What consistently separates LinkedIn accounts with real audience growth from accounts stuck at the same follower count is not posting frequency alone — it is using data to understand what's actually resonating, with whom, and why. The tools exist. The data is accessible. The professionals who act on it are the ones who compound their reach while everyone else guesses.
For a complete overview of how analytics tools fit alongside scheduling and engagement tools in a full LinkedIn workflow, explore the LinkedIn tools guide covering schedulers, carousels, and analytics — or start with the HyperClapper platform for teams who want engagement and analytics in one place.